Comparison of speech quality with and without sensors in electromagnetic articulograph AG 501 recording
Comparison of speech quality with and without sensors in electromagnetic articulograph AG 501 recording Nisha Meenakshi1 , Chiranjeevi Yarra1 , B. K. Yamini2 , Prasanta Kumar Ghosh1 1Electrical Engineering, Indian Institute of Science (IISc), Bangalore-560012, India 2Department of Speech Pathology & Audiology, National Institute of Mental Health and Neuro Sciences (NIMHANS), Bangalore-560029, India 1{gnisha, chiranjeevi.yarra, prasantg}@ee.iisc.ernet.in,2yaminihk@gmail.com Abstract In the recordings using electromagnetic articulograph AG 501, sensors are glued to subject’s articulators such as jaw, lips and tongue and both speech and articulatory movements are simultaneously recorded. In this work, we study the effect of the presence of the sensors on the quality of speech spoken by the subject. This is done by recording when a subject speaks a set of 19 VCV stimuli while sensors are attached to subject’s articulators. For comparison we also record the same set of stimuli spoken by the same subject but with no sensors attached to subject’s articulators. Both subjective and objective comparisons are made on the recorded stimuli in these two settings. Subjective evaluation is carried out using 16 evaluators. Listening experiments with recordings from five subjects show that the recordings with sensors attached are significantly different from those without sensors attached in terms of human recognition score as well as on a perceptual difference measure. This is also supported in the objective comparison which computes dissimilarity measure using the spectral shape information. Index Terms: Electromagnetic Articulography, speech quality, listening test 1. Introduction Electromagnetic articulography (EMA) is a technology used to record the movements of various articulators including lips, jaw, tongue during various speech and non-speech activities. The electromagnetic articulograph AG501 (Carstens Medizinelectronik, Lenglern, Germany) [1] is currently the most developed
收录时间:2020-02-04T10:36:26Z
使用资料正文
Comparison of speech quality with and without sensors in electromagnetic
articulograph AG 501 recording
Nisha Meenakshi1 , Chiranjeevi Yarra1 , B. K. Yamini2 , Prasanta Kumar Ghosh1
1Electrical Engineering, Indian Institute of Science (IISc), Bangalore-560012, India
2Department of Speech Pathology & Audiology,
National Institute of Mental Health and Neuro Sciences (NIMHANS), Bangalore-560029, India
1{gnisha, chiranjeevi.yarra, prasantg}@ee.iisc.ernet.in,2yaminihk@gmail.com
Abstract
In the recordings using electromagnetic articulograph AG 501, sensors are glued to subject’s articulators such as jaw, lips and tongue and both speech and articulatory movements are simultaneously recorded. In this work, we study the effect of the presence of the sensors on the quality of speech spoken by the subject. This is done by recording when a subject speaks a set of 19 VCV stimuli while sensors are attached to subject’s articulators. For comparison we also record the same set of stimuli spoken by the same subject but with no sensors attached to subject’s articulators. Both subjective and objective comparisons are made on the recorded stimuli in these two settings. Subjective evaluation is carried out using 16 evaluators. Listening experiments with recordings from five subjects show that the recordings with sensors attached are significantly different from those without sensors attached in terms of human recognition score as well as on a perceptual difference measure. This is also supported in the objective comparison which computes dissimilarity measure using the spectral shape information. Index Terms: Electromagnetic Articulography, speech quality, listening test
1. Introduction
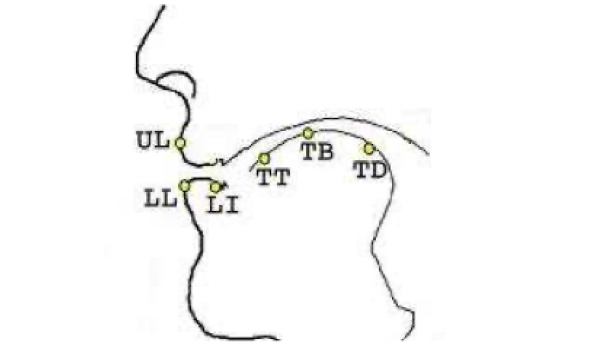
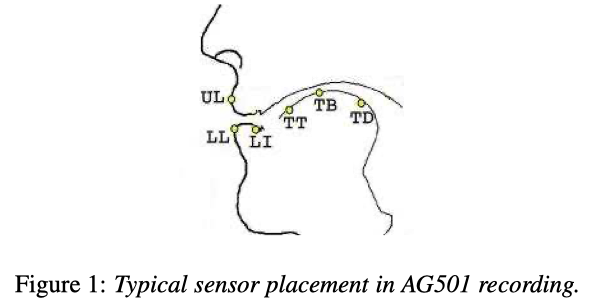
Electromagnetic articulography (EMA) is a technology used to record the movements of various articulators including lips, jaw, tongue during various speech and non-speech activities. The electromagnetic articulograph AG501 (Carstens Medizinelectronik, Lenglern, Germany) [1] is currently the most developed three-dimensional (3D)-EMA system. AG501 has 16 channels which measure the horizontal, lateral and vertical displacement of the sensors as well as their angular orientation in terms of azimuth and inclination. For recording articulatory movement using AG501, sensors are glued on the articulators of interest. Typically, for recording speech related articulatory motions, sensors are attached to several articulators on the midsagittal plane outside oral cavity (upper lip (UL), lower lip (LL)) as well as inside oral cavity (lower incisor (LI), tongue tip (TT), tongue body (TB), tongue dorsum (TD)) as shown in Fig. 1.
Sensors in AG501 are 2.2mm×2.4mm×0.18mm in size [1]. The weight of the sensor along with 1.2m sensor cable is 2.47g [1]. The glue attached to the sensors increases the sensors’ effective size. Glue also increases the weight of the sensor potentially causing discomfort to the subject, particularly with the sensors attached inside oral cavity in a long recording session. Difficulty in uttering speech due to multiple sensors on the tongue using AG500 has been previously reported [2]. The wires attached to the sensors often also cause inconvenience to the subject, hindering subject’s natural movement of articulators or style of speaking. Since the recording setup is different from a natural recording scenario, the speech acoustics from natural recording could be different from that in AG501 recording. It is difficult, in general, to record using any transducer that can be inserted into the mouth, which will not in some way distort the speech event [3]. While the use of imaging techniques could overcome this difficulty, that is not the case with AG501. Hence, a comparison of the speech quality from the recordings with and without sensors in AG501 remains to be investigated.
Speech is driven by auditory goals [4]. The articulatory movement during speech production should be such that the produced speech satisfies the perceptual needs of the listener. AG501 is used for recording these articulatory movements, which often are used as evidence to understand the fundamentals or develop models of speech production. For example, constriction at tongue tip, body and dorsum are required for producing several sounds including /t/, /d/, /s/, /S/, Ù/, /r/ [5]. The constrictions may not happen at proper degree and location due to the presence of sensors on different positions of the tongue. This in turn may reflect on the quality of the produced speech acoustics. Hence, it is necessary to quantify the difference in acoustics, if any, due to the AG501 sensors.
For the present study we have recorded a set of 19 VCV stimuli which are spoken by subjects with and without sensors in AG501 recording. We perform both subjective and objective comparison of these recordings. Subjective comparison is done using listening test by multiple evaluators. Through listening test, a perceptual difference scores on each stimulus are obtained. Evaluators are also asked to recognize each stimulus presented at random to examine how the human recognition performance changes from the with sensor (WS) case to the without sensor (WoS) case. Both these subjective comparisons reveal statistically significant difference between the acoustics from WS and WoS cases. We also perform objective comparison by quantifying the difference in acoustics using spectral shape information, which supports the findings from the perceptual tests.
2. Method
2.1. Subjects
Five healthy subjects (4 Male & 1 Female) have been used for this study, they are denoted by M1, M2, M3, M4 and F1. All subjects gave their (informed) consent for the recording. The age of the five subjects are 46, 47, 70, 70 and 66 years (average age: 59.8yrs(±12.26)). The native languages of M1, M2, M3, M4, F1 are Bengali, Kannada, Hindi, Hindi, Kannada respectively. While all subjects have their native languages different from English, it should be noted that they are educated and fluent in English reading, writing and speaking. The subjects do not have any reported speech defects in their entire life.
2.2. Stimuli
19 non-word VCV (vowel consonant vowel) bi-syllables are used as the stimuli where the vowel is chosen as the phoneme /2/. The consonants are chosen so that they cover various locations of constrictions in the vocal tract during consonant production, namely, bilabial, labiodental, interdental, alveolar, palatal, velar [6] and retroflex. Since the presence of the sensors would interfere with the degree and location of some of these constrictions, this set of 19 VCV stimuli would be appropriate for the intended study in this work. The 19 stimuli (with phonetic transcriptions) are as follows: AFA(/ΛfΛ/), AMA(/ΛmΛ/), ABA(/ΛbΛ/), APA(/ΛpΛ/), ADHA(/ΛdhΛ/), ATHA(/ΛthΛ/), ATA(/ΛtΛ/), ADA(/ΛdΛ/), ANA(/ΛnΛ/), ASA(/ΛsΛ/),ASHA(/ΛSΛ/). The first phoneme of an example Hindi word in bracket ([ ]) corresponds to the consonant of the respective stimuli.
The vowel and each of the consonants listed above are found in the linguistic repertoire of both the subjects who undergo the AG501 recording and the evaluators who participate in the listening tests. It is acknowledged that determining the functional adequacy of the oral structures individually is a means to get to know the speech mechanism; This can be carried out using VCV non words [7]. They do not load the speaker semantically and thus often are excellent choice of material for use in the recording. Another reason for choosing non word stimuli is to avoid semantics as a distractor to the listener while making perceptual judgment.
2.3. Data acquisition procedure and conditions
The AG501 recording of the 19 stimuli by five subjects is done at the Speech Pathology lab at NIMHANS, Bangalore; we follow the guidelines given by the AG501 recording instructions. Super Uni-directional electret condenser microphone, provided with AG501 setup is used for recording. Each subject is seated comfortably for recording and a sheet containing the printed list of stimuli is presented in front of the subjects (along with example words in cases when a subject is not clear about the phonetic symbol). Before the recording, the identity of each phoneme is explained to each subject using words containing the phoneme so that there is no ambiguity between the textual and spoken form of the stimuli. The recording is done in two phases. In the first phase no sensor is attached to the subject’s articulators and subject is asked to repeat each stimulus 5 times with pauses in between. In the second phase, eight sensors are attached to subject’s articulators - two sensors behind two ears for head movement correction and remaining 6 sensors on UL, LL, jaw, TT, TB and TD. Before recording the set of 19 VCV stimuli with sensors attached, the subject is engaged in a natural conversation for 1-2 minutes followed by a set of four tasks, namely, reading passage, repetition of words, rehearsed speech, spontaneous speech on any topic. This is done to help the subject to get used to the sensors attached to his/her articulators. The subjects are then asked to repeat each stimulus 5 times as in the first phase of recording. It is found that M1, M2, M4 can not distinguish AZA and AJA in their spoken form (mainly due to their socio-linguistic background) and they are all recognized as AJA by linguistics expert. Thus the recordings of AZA from these three male subjects are not considered for the present study. Similarly recordings of ASHA from M1 and M4 are excluded due to its confusion with ASA. On the same note, recording of AFA from M1 is also excluded due to its confusion with APA. Thus we have overall 89 clips over all five subjects a total of 178 clips considering both WS and WoS cases 1 .
2.4. Listeners
A total of 16 listeners (evaluators) consisting of 8 males and 8 females participated for subjective evaluation. The listeners are in the age group of 22 to 32 years with an average age of 24.62years(±2.89). The listeners are graduate students at Indian Institute of Science, Bangalore. None of the listeners has any medically diagnosed hearing problem. Similar to five subjects, the listeners also have variety in their native language – Hindi(3), Telugu(5), Malayalam(4), Tamil(1), Kannada(2), Marathi(1). All listeners can read, write, speak English fluently.
3. Subjective comparison
Although all subjects repeat each stimulus 5 times, for the subjective comparison, we manually cut one of the repetitions from the middle of the recording for every stimulus spoken by each subject both WS sensor case. This is done to avoid any effect due to the start and end of the recording on the chosen clip for perceptual test. In the subjective comparison, we conducted two types of listening tests. The goal of the Listening Test 1 (LT1) is to examine if human recognition accuracy of the stimuli changes from the WS to the WoS condition. On the other hand, the goal of the Listening Test 2 (LT2) is to quantify the level of perceptual difference between the clips corresponding to same stimuli but in with and without sensor conditions. The listening tests are conducted in an anechoic chamber using direct sound EX-29 extreme isolation monitoring headphones. The two listening tests are described in the following subsections.
3.1. Listening Test 1
3.1.1. Description of test set up
In LT1, an evaluator is presented with a clip at random and then asked to classify it as one of the 19 stimuli. The listener is allowed to listen to the presented clip as many times as possible. This is done by a graphical user interface (GUI) developed using MATLAB R2013a as shown in Fig. 2.I. The GUI consists of four sections namely the listening panel, selection panel, indicator panel and the relaxation panel. The listening panel enables the evaluators to listen to the sound clips presented at random. In the selection panel 19 stimuli names are presented, any of which an evaluator could select, to classify the presented clip. ‘None of the above’ option is also included in the selection panel, to aid the evaluators, in case they could not classify the presented clip into one of the 19 stimuli. The indicator panel gives the percentage of all stimuli completed. The relaxation panel provides four songs for the evaluators to listen to, any time they wanted to relax during the test. The average time taken by each evaluator to perform this listening test is found to be ∼20 minutes. 12 random clips from 178 clips are chosen and presented for LT1 in addition to 178 clips (thus, a total of 190 clips). This is done to check the level of consistency of the evaluators. The evaluators are explained about the details of the listening test before the test begins.

3.1.2. Results and discussions
From the listening test of 12 additional clips (used for consistency check) it is found that 6 evaluators are 100% consistent; another 6 evaluators are found to be inconsistent in only 1 of 12 clips (∼92% consistent); two evaluators are inconsistent in 2 of 12 clips (∼83% consistent) and two other evaluators are inconsistent in 3 of 12 clips (∼75% consistent). Since all evaluators are consistent by 75% or more, we include all 16 evaluators for the present study. For each of 178 clips, we obtain the human recognition (HR) accuracy by finding how many evaluators among 16 correctly classify the respective clip 2 . Thus we obtain HR accuracies for 89 pairs of clips across all subjects separately – each pair corresponds to the WS and WoS conditions. The mean and standard deviations (SD) of these recognition accuracies are shown in Table 1. We also report these accuracies by considering clips of only male and only female subjects separately. We perform a Wilcoxon test [8] to find statistically significant difference between WoS and WS cases. The p-values from the test are also reported in Table 1.
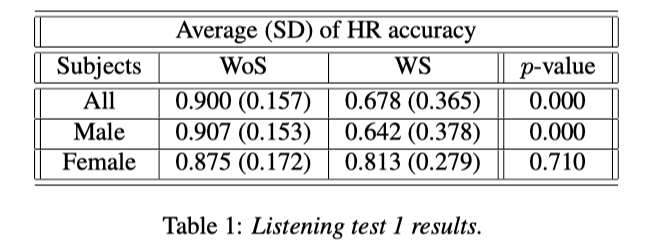
From the Table 1 it is clear that the average HR accuracy over all subjects is significantly higher in the WoS case compared to that in WS case at 95% significance level. This could be because subjects can articulate more freely without sensor than with sensors attached, particularly for those stimuli where the sensors interfere the most. This is also the case when HR accuracies of male subjects are considered. However, that is not the case with the female subject. This implies that, unlike male subjects, the female subject could maintain her speech quality even when sensors are attached to her articulators while that is not the case with male subjects. Further investigation reveals that there are five stimuli, namely, ATHA(voiceless dental fricative), ACHA(voiceless postalveolar affricate), ATA(voiceless alveolar stop), AJA(voiced postalveolar affricate), and ADHA(voiced dental fricative), which got less than 50% HR accuracy in WS condition, particularly, 28.75%, 33.75%, 37.5%, 38.75%, 42.5% respectively. They are most confused with APA, ASHA, ACHA, AZA and AZA respectively. Thus, it is clear that production of all the stimuli for which HR accuracy drops require constriction at different parts of the tongue where sensors are attached. Thus, sensors on the tongue could be the main reason for the change in the HR accuracy.
3.2. Listening test 2
3.2.1. Description of test set up
The GUI for LT2 is shown in Fig. 2.II. This GUI consists of similar panels as in the GUI of the Listening test 1. Here, the evaluators are presented with a pair of audio clips corresponding to a particular stimulus from a subject. After listening to the two clips, the evaluators are asked to select one of the five options, from the selection panel, to quantify the perceptual difference in the stimuli. The evaluators could listen to each clip as many times as required. The LT2 is done at identical place as that of LT1 but at a different time so that the evaluators are not bored due to long listening session. The average time taken by the evaluators for LT2 is found to be ∼12 minutes. The scale of perceptual difference are given following degradation category rating (DCR) method [9] as follows:
• 0 - Similar clips
• 1 - Difference is audible but not prominent
• 2 - Difference is slightly prominent
• 3 - Difference is prominent
• 4 - Difference is very prominent
3.2.2. Results and discussions
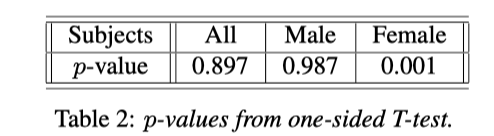
From each evaluator, we obtain 89 scores each for a pair of clips corresponding to WS and WoS conditions. The distribution of scores from all evaluators are as follows: 51.13%(0),22.13%(1), 7.55%(2), 9.44%(3), 9.74%(4). These scores are then averaged for every stimulus over all evaluators. Since only a score of 0 corresponds to perceptually identical stimuli, we perform an one-sided T-test (H 0 = µ ≥ 1). One sided T-test is also performed on scores separately for male (70 scores) and female (19 scores) subjects. The p-values obtained from the T-test are shown in Table 2. From the Table 2, it is clear that we can not reject the H 0 for all subject and male subjects case but that for female subject can be rejected at 95% significance level. This suggests that the speech quality in the WS case could be perceptually different from that in the WoS case. While this also is true for male subjects, this is not the case with the female subject suggesting that the female subject maintains her speech quality although sensors are attached to her articulators. This is consistent with the finding from LT1.
From further investigations, it is observed that the perceptual difference score averaged across all evaluators is equal or more than 3 for ACHA, ADHA of M1, and ADA, ADHA, ATA, ATHA, AFA of M2. Interestingly the HR accuracy (LT1) for all these stimuli is less than 50%. For all clips of the female subject the average perceptual difference score is 0 or 1. This suggests that the difference in perceived speech quality could be subject specific, i.e., some subjects can maintain the speech quality although the sensors are attached to his/her articulators while that is not true for other subjects.
4. Objective comparison
In the objective comparison between the recordings in WS and WoS conditions, we would like to quantify the difference in the acoustics in these two recording conditions. For this purpose we use all five tokens of one stimuli by each subject unlike one token for the subjective evaluation. We represent each token of a stimuli by a sequence of Mel frequency cepstral coefficients (MFCCs). MFCCs are computed using 20msec frame duration and 10msec frame shift [10]. The first and second derivatives of MFCCs are computed and appended to the MFCC feature vector constructing a 39 dimensional acoustic feature vector. Note that each token will have different duration and, hence, different number of frames. To compensate for the difference in duration of two tokens in objective comparison, we perform dynamic time warping (DTW) [11] between two sequences of MFCCs with Euclidean distance measure. Thus, the acoustic distance D between two tokens is defined as the average Euclidean distance between the two corresponding MFCC sequences after DTW alignment.
4.1. Results and discussions
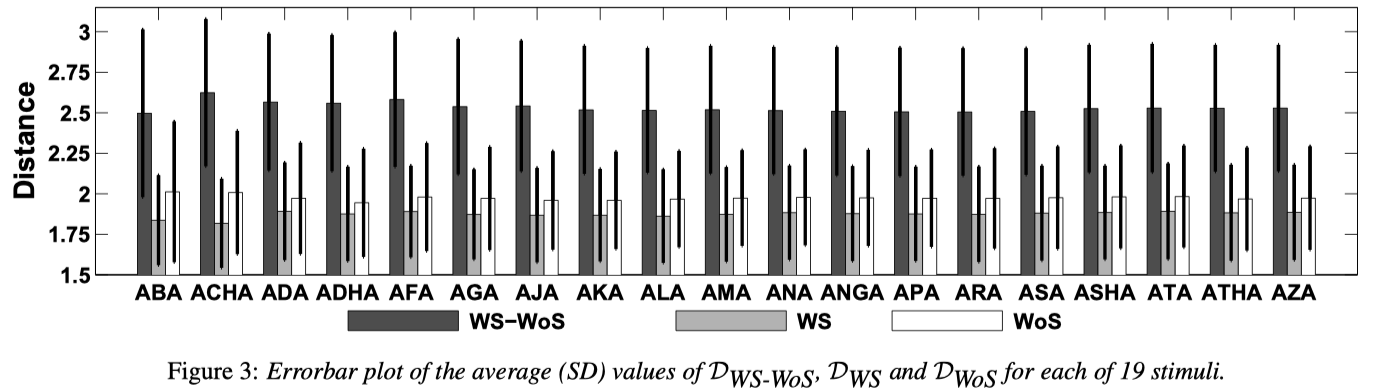
From all five tokens of a stimuli spoken by a subject in both WS and WoS conditions, we compute the distance measure for all 25 pairs of WS-WoS tokens. They are denoted by D WS-WoS . D WS-WoS indicates the acoustic difference between token in WS and WoS conditions. To compare these distances against a reference distance we also compute the acoustic distance measure between every pair of tokens within WS and WoS conditions separately. These are denoted by D WS and D WoS respectively. Considering five tokens in each of WS and WoS conditions, we obtain 10 values of D WS and D WoS each. Considering all stimuli of all subjects (i.e., 89 combinations) we obtain, we obtain 2225, 890, and 890 values of D WS-WoS , D WS , and D WoS respectively. The average values of these measures are shown in Table 3 along with their standard deviations. Table 3 also shows the average distance measure when only male and only female subjects are considered separately. We perform a statistical test for equality of means for comparing D WS-WoS with D WS and D WS-WoS with D WoS separately.
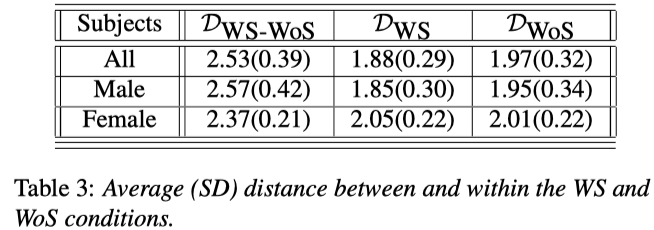
From Table 3, it is clear that D WS-WoS is significantly higher than both D WoS and D WS (p <0.001; in both cases) when all subjects’ recordings are considered. This is also true when only male and only female subjects’ recordings are considered. This suggests that there is a significant change in acoustic variabilities due to the presence of the sensors. D WoS and D WS are also found to be significantly (p=0.000) different for all and male subjects cases unlike that for the female subject (p=0.128). Higher average value in the WoS case than WS case could be due to the fact that in the presence of sensors subjects have limited scope of articulatory movement leading to lesser variability in acoustics. Fig. 3 shows the average (SD) values of D WS-WoS , D WS , and D WoS for each of the 19 stimuli. It is found that D WS-WoS is significantly higher than each of D WS and D WoS in the case of all these stimuli at 95% significance level. /2Ù2/, /2dh2/, /2th2/ are three stimuli with the highest D WS-WoS ; interestingly, the listening test scores are also low for these stimuli as discussed in section 3.1.2.
5. Conclusions
We compare the speech quality with and without sensors in AG501 recordings. Comparison is done using both subjective and objective metrics on recordings of 19 VCV stimuli from five subjects, four male and one female. The results from objective comparison match with that from the subjective comparison when all subjects’ data are considered. They both indicate that attaching sensors to subjects’ articulators changes the speech acoustics significantly from recordings without sensors. Stimuli that require constrictions at different portions of the tongue having sensors attached are found to be the ones for which the change in acoustics is significant. The findings from the subjective and objective comparisons do not match in the case of female subject. While subjective comparison implies no significant changes due to sensor attachment, the objective measure shows a significant difference. This indicates that the change in the speech quality due to the presence of sensor could be subject specific. This could be due to the fact that different subjects take different amount of time to adjust themselves to the AG 501 recording setup. Further analysis is required to quantify the effect of this acoustic difference when recordings from AG501 are used for speech applications such as recognition of speech, speaker, or emotion. Similar comparison using speech over a larger set of subjects would be more insightful.
6. References
[1] “3D electromagnetic articulograph,” http://www.articulograph.de.
[2] Z. M. Hassan and B. Heselwood, Instrumental Studies in Arabic Phonetics. John Benjamins Publishing, 21 December 2011.
[3] W. J. Hardcastle, J. Laver, and F. E. Gibbon, The Handbook of Phonetic Sciences, 2nd ed. Wiley-Blackwell, 17 September 2012.
[4] S. M. Nasir and D. J. Ostry, Control of movement precision in speech production. In: Maassen B and van Lieshout P (eds) Speech motor control -New developments in basic and applied research; Oxford University Press, 2010.
[5] C. P. Browman and L. Goldstein, “Articulatory gestures as phonological units,” Phonology, vol. 6(2), pp. 201–251, 1989.
[6] D. O’Shaughnessy, Speech Communications: Human and Machine, 2nd ed. Wiley-Blackwell, 16 November 1999.
[7] P. K. Hall, “The oral mechanism,” In: Tomblin J.B., Morris H.L. & Spriesterbach D.C (eds.) Diagnosis in SpeechLanguage Pathology, pp. 67–98, 1994.
[8] M. Hollander and D. A. Wolfe, Nonparametric Statistical Methods. NJ: John Wiley & Sons, Inc., 1999.
[9] C. Nicolas, Integral and diagnostic intrusive prediction of speech quality. Springer, 2011.
[10] S. J. Young, “The HTK hidden Markov model toolkit: Design and philosophy,” Entropic Cambridge Research Laboratory, Ltd, vol. 2, pp. 2–44, 1994.
[11] M. Muller, “Dynamic time warping,” Information retrieval for music and motion, pp. 69–84.