Kaytetye consonant contrasts without contours
Kaytetye consonant contrasts without contours Susan Lin, Benjamin Davies, and Katherine Demuth Macquarie University Two of the benefits of articulatory research using ultrasound technology are (a) the relative immediacy of access to visual information and (b) the portability of many ultrasound devices. Both points make ultrasound imaging an attractive option for field researchers interested in documenting lingual movement in remote locations. Typical procedures for extracting and analysing data from ultrasound video involve at least 3 steps: extraction of individual frames from ultrasound video, followed by edge-detection of lingual contours, and calculation of difference and/or distance measures based on above contours. These steps, especially edge-detection, are often time-consuming and are often not suitable for quick visual comparisons while in the field. We describe an alternate approach (which we call “sighted” for the time being) potentially more suitable for such applications, and compare results using sighted values approach against results using more traditional measured values. Procedures The ultrasound images used in this comparison were extracted from ultrasound video recordings of native speakers of Kaytetye, an endangered Arandic language spoken near Alice Springs, NT, Australia. Like most Arandic languages, Kaytetye contains a four-way coronal place contrast – dental, alveolar, palatal, and retroflex – in oral stops, nasal stops, pre-stopped nasals, and laterals. For the purpose of this comparison, we targeted the articulatory differences between the dental stop /t̪/ and the alveolar stop /t/. Ultrasound video was collected from seven female speakers of Kaytetye, who produced 16-24 instances of the target consonants in either /a#_a/ or /a#_əə/ contexts. For each target sequence, two frames from the ultrasound video were manually selected: 1 Vocalic frame – one frame from production of the preceding vowel /a/, during lingual stability 2 Consonantal fr
收录时间:2020-02-06T02:16:23Z
使用资料正文
Kaytetye consonant contrasts without contours
Susan Lin, Benjamin Davies, and Katherine Demuth
Macquarie University
Two of the benefits of articulatory research using ultrasound technology are (a) the relative immediacy of access to visual information and (b) the portability of many ultrasound devices. Both points make ultrasound imaging an attractive option for field researchers interested in documenting lingual movement in remote locations.
Typical procedures for extracting and analysing data from ultrasound video involve at least 3 steps: extraction of individual frames from ultrasound video, followed by edge-detection of lingual contours, and calculation of difference and/or distance measures based on above contours. These steps, especially edge-detection, are often time-consuming and are often not suitable for quick visual comparisons while in the field. We describe an alternate approach (which we call “sighted” for the time being) potentially more suitable for such applications, and compare results using sighted values approach against results using more traditional measured values.
Procedures
The ultrasound images used in this comparison were extracted from ultrasound video recordings of native speakers of Kaytetye, an endangered Arandic language spoken near Alice Springs, NT, Australia. Like most Arandic languages, Kaytetye contains a four-way coronal place contrast – dental, alveolar, palatal, and retroflex – in oral stops, nasal stops, pre-stopped nasals, and laterals. For the purpose of this comparison, we targeted the articulatory differences between the dental stop /t̪/ and the alveolar stop /t/. Ultrasound video was collected from seven female speakers of Kaytetye, who produced 16-24 instances of the target consonants in either /a#_a/ or /a#_əə/ contexts. For each target sequence, two frames from the ultrasound video were manually selected:
1 Vocalic frame – one frame from production of the preceding vowel /a/, during lingual stability
2 Consonantal frame – one frame from production of the target consonant, at peak constriction
Sighted
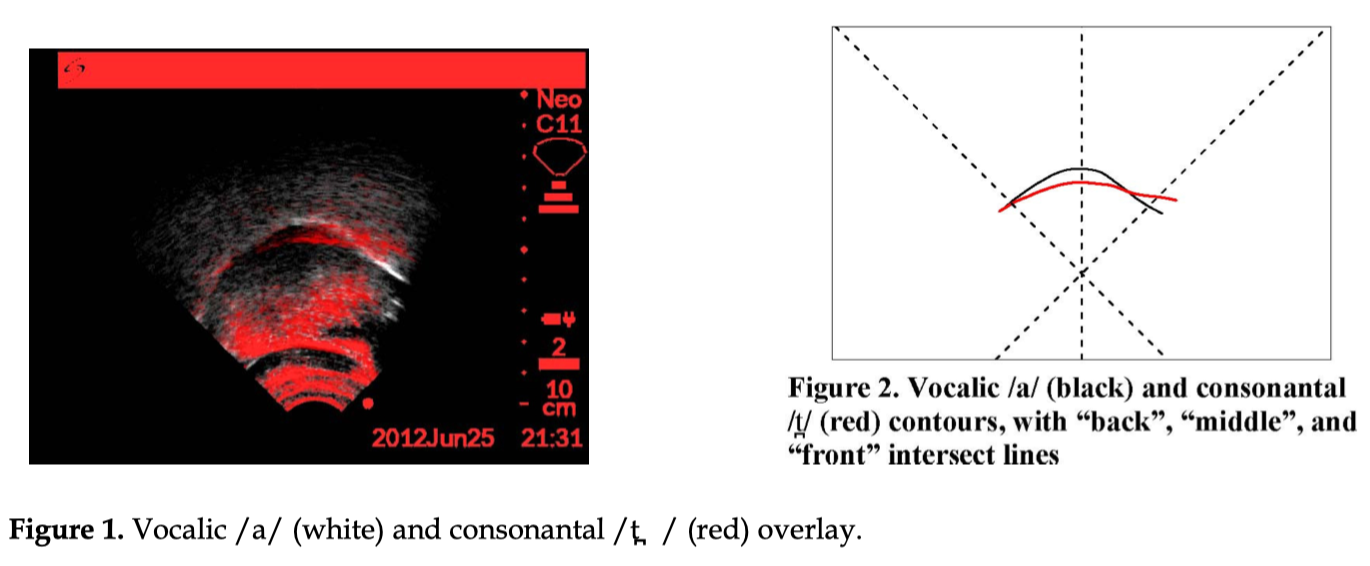
In the sighted approach, the consonantal frame was tinted red, with all pixels below a specific black threshold made transparent, then superimposed on the vocalic frame. This process was repeated for each item, resulting in a single overlay image (as in Figure 1) for each target utterance. These images were given to a naive coder, who has seen lingual ultrasound images previously, but who has had no training in ultrasound speech research. The coder was instructed to “mentally trisect the white line in the centre of the image, and give each section a rating of +1/0/-1 if the red line is farther from/the same distance as/closer to the centre of the image.”
Measured
For the more traditional measures, the lingual contour was traced in both the vocalic and consonantal frames, using EdgeTrak (Li et al. 2005). Three lines were created to approximate the trisection used in the sighted task (see Figure 2), and the distance (in pixels) between the black vocalic contour and the red consonantal contour were calculated. If the red consonantal contour was further from the point of origin of the three lines, the distance value was positive; otherwise, if it was closer to the point of origin, the distance value was negative, mirroring the polarity of the Height values from the sighted task.
Results
For the purpose of testing comparability of results, we asked the following question: does production of alveolar compared to dental stops in Kaytetye involve different motion of the tongue in the back/middle/front?
Measured results
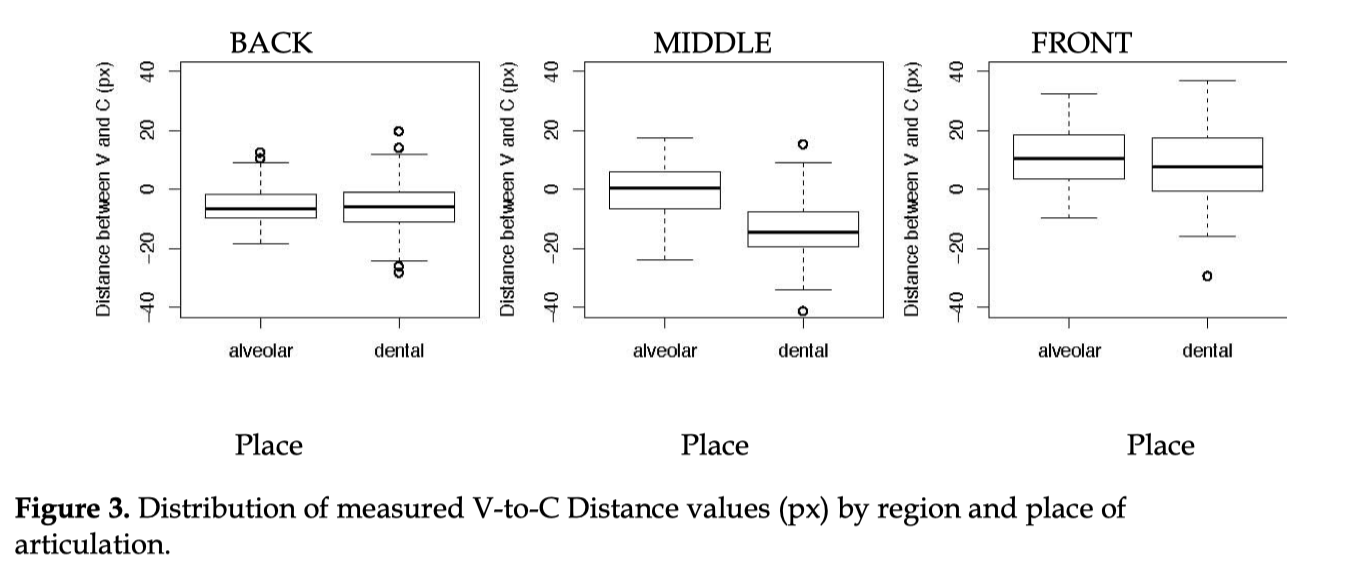
A set of linear mixed effects models was run using the lme4 package in R (Bates et al. 2012) on the Vto-C Distance values, separately in each region (back, middle, front), with fixed factor Place (alveolar or dental), and random factors Subject, Word, and Repetition.
Figure 3 shows, for each region, the distribution of measured Distance between alveolar and dental stops. In the Back region, Distance between vocalic and consonantal contours were not significantly different between alveolar and dental places of articulation (β = -0.30, t = -0.25, p = 0.8042). In the Middle region, consonantal contours in dental stops were significantly lower compared to alveolar stops (β = -13.34, t = -10.95, p < 0.0001). In the Front, consonantal contours were again significantly lower in dental stops compared to alveolar stops, but the magnitude of difference was substantially smaller than in the Middle region (β = -3.40, t = -2.32, p = 0.0217).
Sighted results
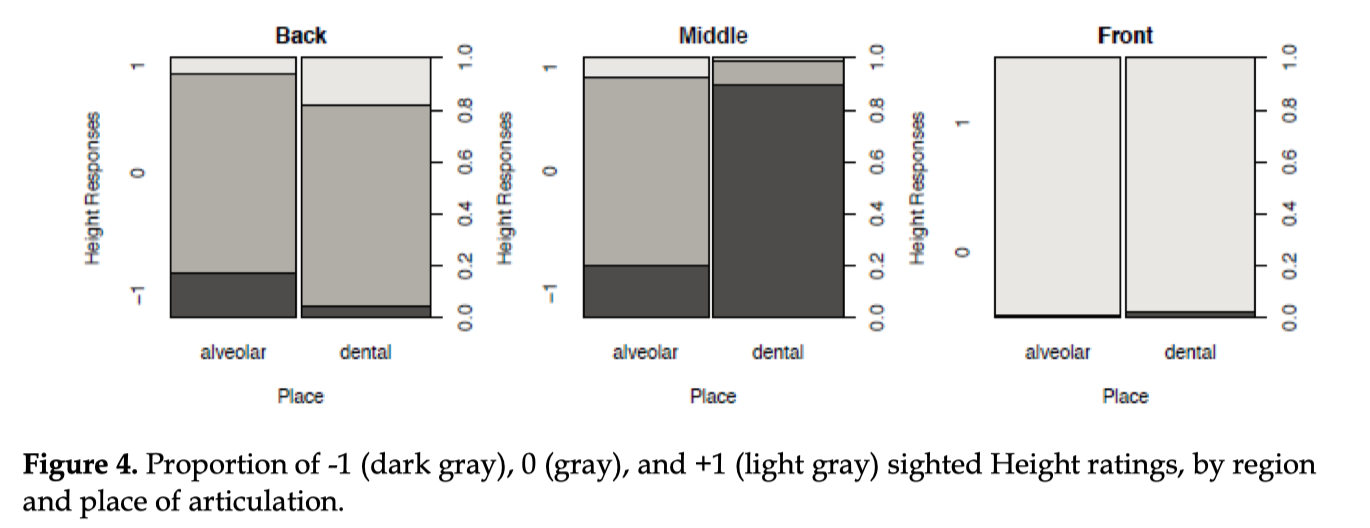
Another set of linear mixed effects models was run the sighted Height values, again separately in each region, with fixed factor Place, and random factors Subject, Word, and Repetition.
Figure 4 shows, for each region, the proportion of sighted Height ratings between alveolar and dental stops. Results in the Back and Middle regions match the results for the measured values: Place did not have a significant effect on Height scores (β = 4.08, z = -6.823, p = 0.4544) in the Back region, but Height was significantly more likely to be negative in dental stops than alveolar stops (β = -4.94, z = 6.82, p <0.0001). In the Front, Height scores were not significantly affected by Place (β = -0.19, t = 0.002, p =0.9980), in contrast with the results from the measured
Measured v. sighted results
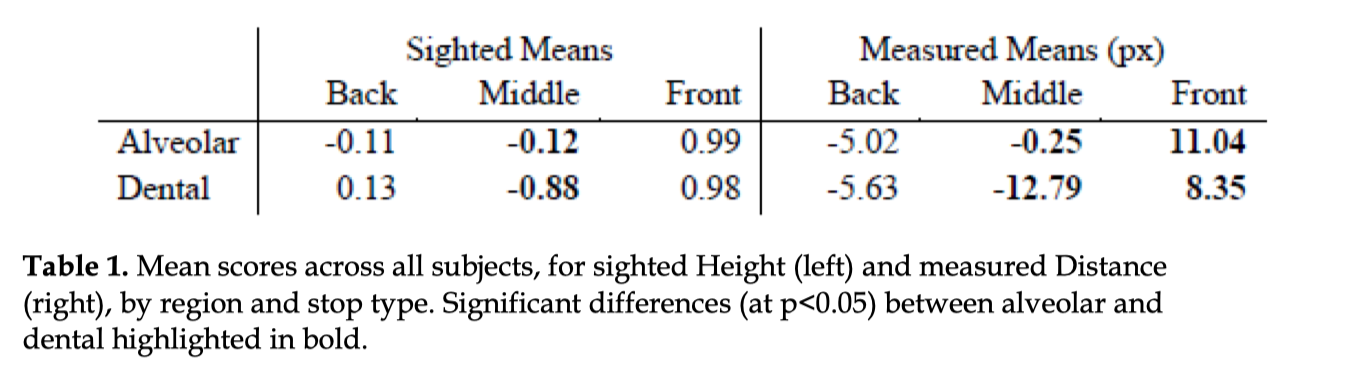
Table 1 displays the mean values for both Distance and Height, for this particular question. The sighted ratings concur with the measured distances for two of the three regions: Back and Middle. However, the difference in magnitude of tongue raising in the Front region was not picked up by the sighted Height ratings. This is likely due to the sighted rating system outlined above not allowing for rating of different magnitudes, resulting in the vast majority of items, whether alveolar or dental, having a +1 (raising) rating in the Front region.
We also compared, more directly, the values from the two methods. Figure 5 shows, for each region, the measured Distances by Height rating. In this figure, values were aggregated across Place. We ran a linear mixed effects model, with measured Distance as the (continuous) dependent variable, and sighted Height as a (discrete 3-level) fixed factor. Subject, Iteration and Place were included as random factors. Again, the comparison was run independently for each region. For the discrete 3-level factor Height, 0 was set as the base value for comparison.
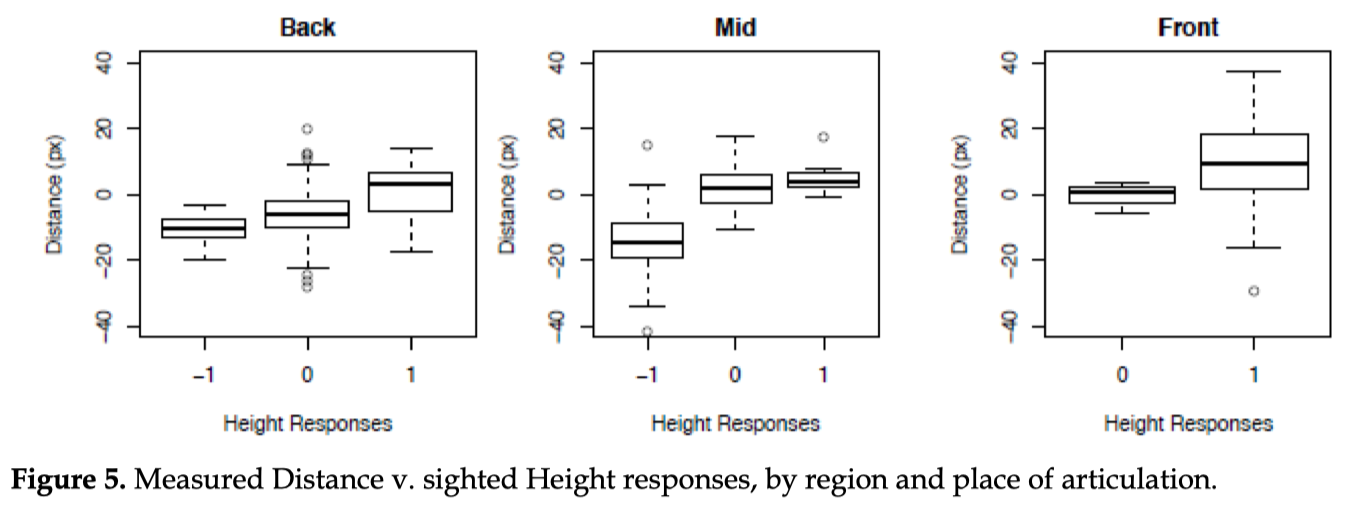
For the Back region, measured Distance was significantly lower when sighted Height was -1, compared to 0 (β = -4.16, t = -2.12, p = 0.0360), and significantly higher when Height was +1 (β = 5.88, t = 3.07, p =0.0025). Similarly, for the Mid region, measured Distance was significantly lower when Height was -1 (β = -11.15, t = -7.11, p < 0.0001), and significantly higher when Height was +1 (β = 6.66, t = 2.49, p =0.0138).
In contrast, for the Front region, sighted Height was not a significant predictor for measured Distance (β = 1.67, t = 0.31, p = 0.7583). It is quite plausible, however, that the lack of significant correlation between the two metrics in the Front region is due once again to the fact that exceedingly few items resulted in a 0 or -1 rating for Height – 3 of 165 total items, or 1.8% of all items.
Discussion
The sighted ratings approach appears to be most informative when differences are sufficiently large. There are several ways in which the very basic approach outlined here could be amended to result in measures that are more comparable to a more traditional measured approach.
In the sighted procedure outlined here, the coder was given extremely broad instruction as far as where to focus his attention. Some of the differences between polarity (+/-) between human coding and distance measures in our comparison are likely due to focus at different locations. While the measured procedures fixed location of measure, the sighted procedure allowed the coder to choose any region that he felt was sufficiently “forward,” “backward,” or “central.” Restricting the area of focus visually for the human coder could be achieved using a reasonably simple procedure, such as adding opaque overlay to the combined image, to obscure visual access to a specific area.
Of course, one of the clear advantages of traditional measures, compared to the sighted procedure outlined in this abstract, is the availability and interpretability of differences in magnitude. To partially address this, the sighted procedure outlined here may be expanded to include more granularity. For instance, the coder may have five degrees of difference to choose from instead of three. Even so, the use of sighted procedures, as a whole, are likely not appropriate for issues that investigate very small differences.
References
Li, Min, Yusuf Akgul, & Chandra Kambhamettu. 2005. EdgeTrak [Computer Program]. Version 1.0.0.4. Retrieved October 3, 2008, from vims.cis.udel.edu/EdgeTrak/.
Bates, Douglas, Martin Maechler, & Ben Bolker. 2012. lme4: Linear mixed-effects models using S4 classes [R Package]. Version 0.999999-0. Retrieved July 10, 2012, from cran.r-project.org.