Ultrasound images in the new ‘iPA Phonetics’ App
Ultrasound images in the new ‘iPA Phonetics’ App Christopher Coey1 , John H. Esling1 , Scott R. Moisik2 1University of Victoria, 2Max Planck Institute for Psycholinguistics The phonetic chart in an App iPA Phonetics is an application that illustrates the sounds and articulations of an expanded version of the IPA chart. The App gives users of Apple iOS mobile electronic devices the ability to access and compare and, through matching ‘games,’ to test their knowledge of phonetic symbols and sounds together with their visual production correlates, including video of the oral vocal tract, video of the laryngeal vocal tract, and ultrasound of the laryngeal vocal tract. The App is entirely ‘self-contained’ in that once downloaded it requires no internet connection to use. The chart format follows the design of the elaborated chart of speech sounds of the IPA published in Esling’s chapter on notation in: Hardcastle, Laver & Gibbon (Eds.), The Handbook of Phonetic Sciences, 2nd ed. Oxford: Wiley-Blackwell (2010). The consonant chart contains 14 columns for place of articulation and 13 rows for manner of articulation. There are 4 major regions delimited in the chart separating labial, tongue-front, tongue-back, and laryngeal sounds. Diacritic qualifications of sound quality are included in the extra symbols themselves that appear in the chart, some of which derive from the ExtIPA (Duckworth et al. 1990, Ball 1991). There are 223 consonant symbols/sounds in the chart. A vowel chart is also included, which follows the format of the 2005 IPA chart. There are 28 symbols/sounds in the vowel chart, with two styles of production: long and short. Video/audio recordings associating the production of a phonetic sound with each symbol were captured using the KayPENTAX 9105 70º-angle rigid oral laryngoscope fitted with a 35mm lens to capture oral articulations and a 28mm wide-angle lens to capture laryngeal articulations (Esling 1996, 1999) and connected through the Panasonic GP-US522 ca
收录时间:2020-02-06T08:13:13Z
使用资料正文
Ultrasound images in the new ‘iPA Phonetics’ App
Christopher Coey1 , John H. Esling1 , Scott R. Moisik2
1University of Victoria, 2Max Planck Institute for Psycholinguistics
The phonetic chart in an App
iPA Phonetics is an application that illustrates the sounds and articulations of an expanded version of the IPA chart. The App gives users of Apple iOS mobile electronic devices the ability to access and compare and, through matching ‘games,’ to test their knowledge of phonetic symbols and sounds together with their visual production correlates, including video of the oral vocal tract, video of the laryngeal vocal tract, and ultrasound of the laryngeal vocal tract. The App is entirely ‘self-contained’ in that once downloaded it requires no internet connection to use.
The chart format follows the design of the elaborated chart of speech sounds of the IPA published in Esling’s chapter on notation in: Hardcastle, Laver & Gibbon (Eds.), The Handbook of Phonetic Sciences, 2nd ed. Oxford: Wiley-Blackwell (2010). The consonant chart contains 14 columns for place of articulation and 13 rows for manner of articulation. There are 4 major regions delimited in the chart separating labial, tongue-front, tongue-back, and laryngeal sounds. Diacritic qualifications of sound quality are included in the extra symbols themselves that appear in the chart, some of which derive from the ExtIPA (Duckworth et al. 1990, Ball 1991). There are 223 consonant symbols/sounds in the chart. A vowel chart is also included, which follows the format of the 2005 IPA chart. There are 28 symbols/sounds in the vowel chart, with two styles of production: long and short. Video/audio recordings associating the production of a phonetic sound with each symbol were captured using the KayPENTAX 9105 70º-angle rigid oral laryngoscope fitted with a 35mm lens to capture oral articulations and a 28mm wide-angle lens to capture laryngeal articulations (Esling 1996, 1999) and connected through the Panasonic GP-US522 camera to video/audio/ultrasound channel synchronizing software. Camera angles begin with the scope outside of the mouth, progressing further inside of the mouth for tongue-back recordings, and over the back of the tongue to view laryngeal activity. The video/audio recordings are accessed in the App by clicking on consonant symbols or vowel symbols. A diagram of the Laryngeal Articulator Model of the vocal tract (Esling 2005) is also included, elaborated with a set of clickable voice quality labels, representing sound quality associated with various parts of the vocal tract, and accompanied by illustrative recordings.
Ultrasound illustrations in the App
Ultrasound images of consonant sound production have been included together with the laryngoscopic video/audio for the last two columns of the consonant chart (the laryngeal region: Pharyngeal/Epiglottal and Glottal). This articulatory region of the vocal tract has always been elusive to visualize, and ultrasound techniques applied to this region are rare. Ultrasound images were captured using a GE portable LOGIQe R5.0.1 system with an 8C-RS (convex) probe to image supraglottal laryngeal involvement (e.g. for Glottal stop) and with an 12L-RS straight-line probe at a relatively shallow 2-4 cm depth on the neck and about 2-4 cm of the vertical dimension for clear resolution of laryngeal structures to image larynx height changes (e.g. for Pharyngeal/Epiglottals). This is a novel laryngeal technique that differs from the approach usually taken in oral lingual ultrasound data capture (Moisik 2013).
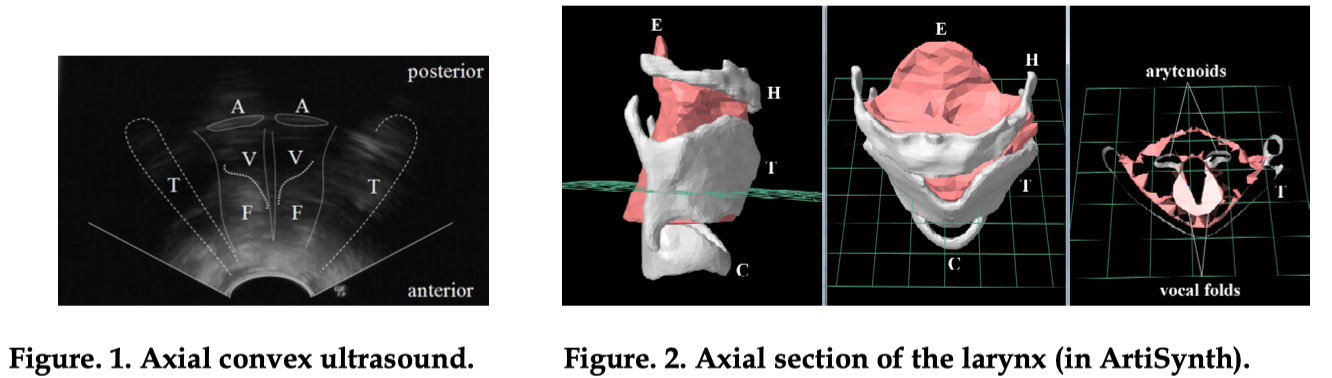
Key to the labels in the diagrams and ultrasound views:
A = arytenoid cartilage, AE = aryepiglottic fold, C = cricoid cartilage, E = epiglottis,
F = ventricular fold, H = hyoid bone, L = vocal ligament, T = thyroid cartilage, V = vocal fold
Three ultrasound viewing options for laryngeal sound production are included in the App. The first perspective was captured with the 8C-RS (convex) probe in an axial (horizontal) orientation at the front of the larynx. The second perspective was captured with the 8C-RS (convex) probe in a vertical orientation at the front of the larynx. The third perspective was captured with the 12L-RS (flat) probe in a quasi-vertical orientation towards the side of the larynx. The ultrasound viewing option can be selected with a toggle switch.
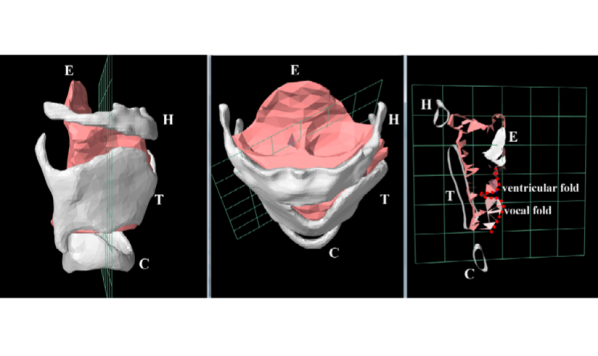
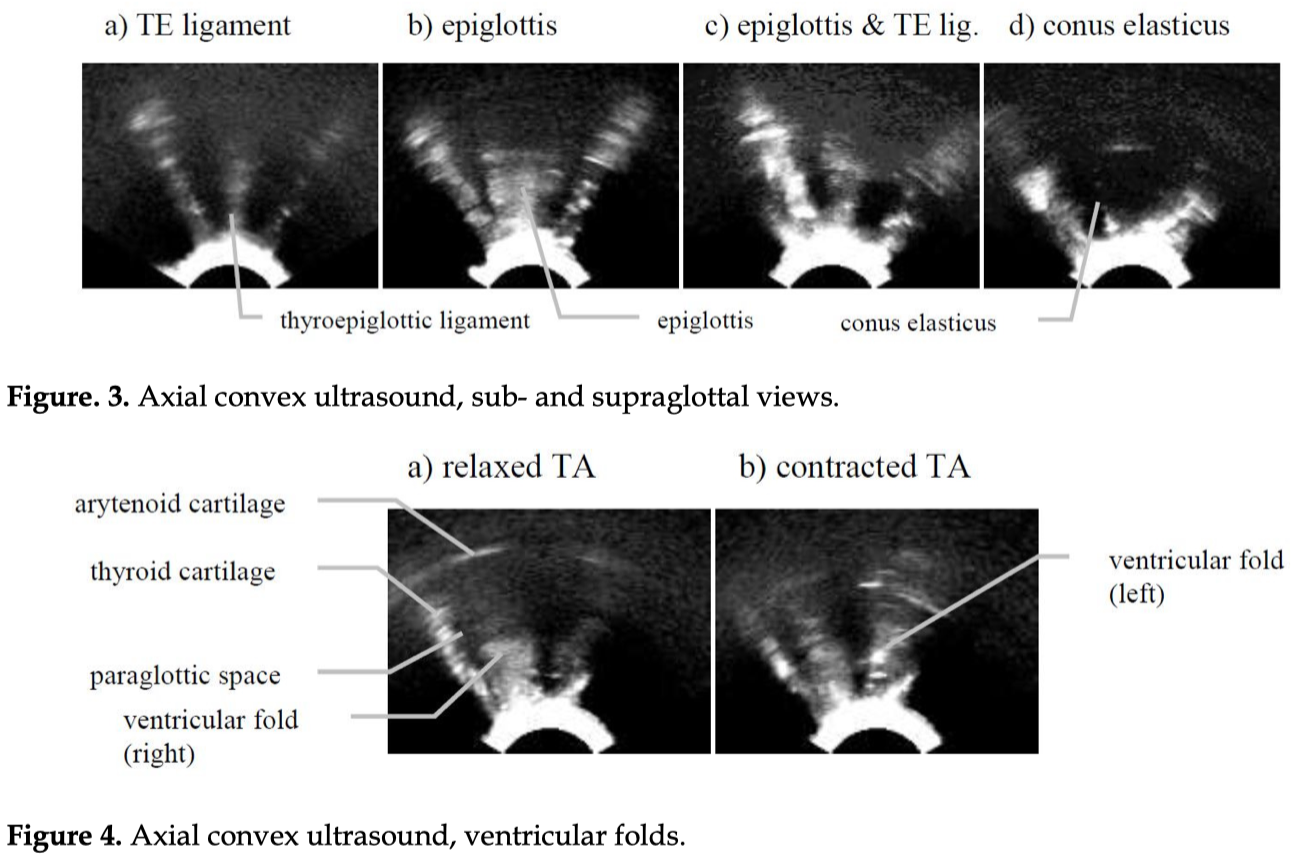
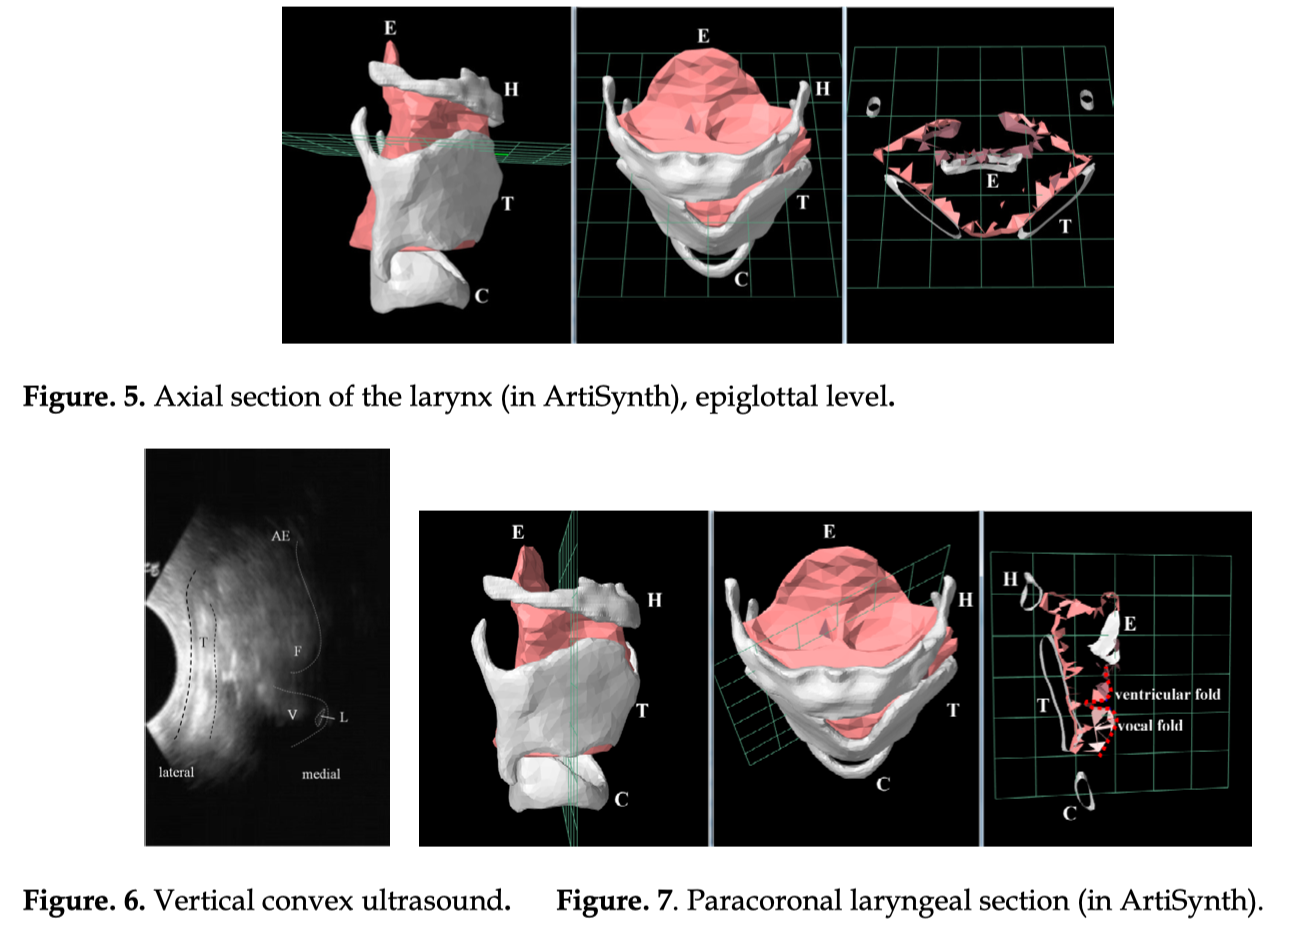
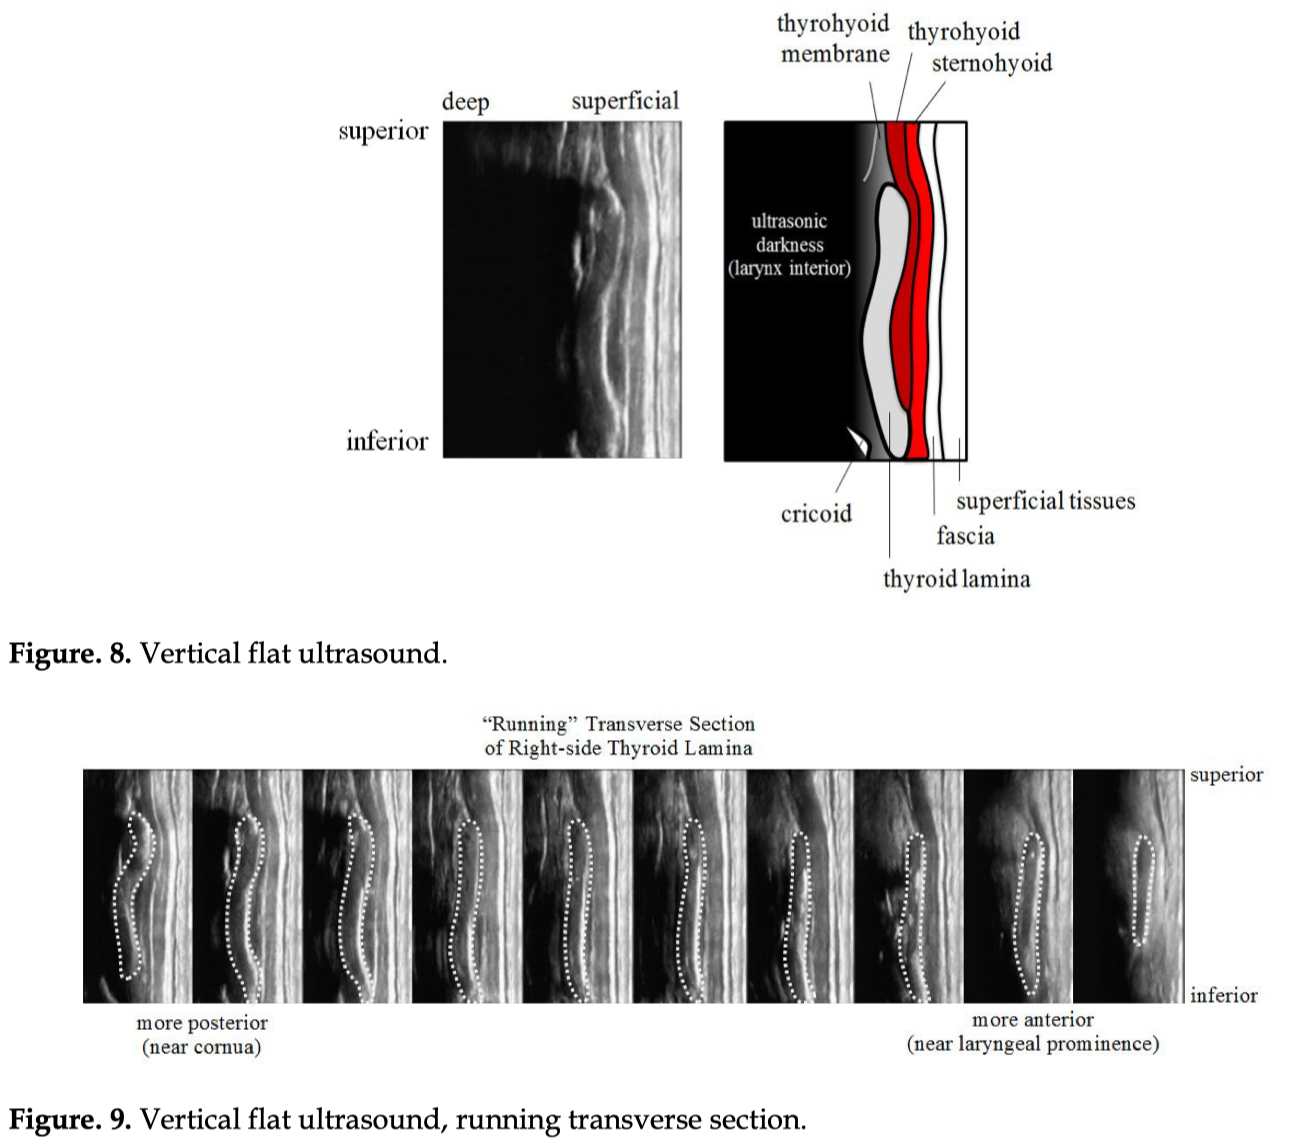
The axial (horizontal) convex ultrasound view is shown in Figure 1. This orientation corresponds to the physical structures of the larynx in Figure 2, which have been modelled in the ArtiSynth environment (Moisik & Gick 2013). The horizontal section in Figure 2 is at the level of the vocal folds. The anatomical sections in the models are shown in parallel with the corresponding labelled ultrasound images to illustrate what can be seen using laryngeal ultrasound. Both the labelled ultrasound diagrams and laryngeal model diagrams appear in the beta version of the iPA Phonetics App, assembled onto one ‘INFO’ page, viewable by pressing the info button next to the US-video ANGLE buttons. Figures 3 and 4 illustrate various epilaryngeal-level (see Figure 5) structures visible in the axial convex ultrasound view. Figure 6 depicts the near-coronal or paracoronal view (see Figure 7) obtained from vertical orientation of the convex probe. Note that the red dotted line in Figure 7 delineates the vocal and ventricular folds and roughly corresponds to the white dotted line in Figure 6. Finally, Figures 8 and 9 demonstrate the vertical imaging plane captured using the flat probe held upright. With this probe, the penetration depth tends to be weaker, but the structural resolution of the superficial layers of tissue and the thyroid lamina are much more crisply imaged. Figure 9 depicts a series of images obtained by sliding the probe along the thyroid lamina posterior to anterior. This series provides an impression of the three-dimensional geometry of the lamina and the surrounding muscular and connective tissues.
General purposes for the App
The purpose of this free App is to introduce the general public as well as specialized users of IPA symbolization, via iPhone/iPad technology, to the inventory of possible speech sounds of the languages of the world and to how each sound is physically articulated. Each sound category can be listened to and viewed in the form of close-up oral-endoscopic videos of the vocal tract. Pharyngeal/Epiglottal and Glottal (Laryngeal) articulations are also accompanied by laryngeal ultrasound images, which can be compared with the laryngoscopic videos of the same sound productions. Ultrasound images of this region of the vocal tract have not been included in any other database of articulatory categories that we know of. The ultrasound images for these lower-vocal-tract articulations may be compared, for example, with the lingual ultrasound images for the sounds of the phonetic chart contained in the Carnegie Trust Ultrasound Tongue Imaging Resource (http://www.seeingspeech.arts.gla.ac.uk/uti/). (Glasgow, Queen Margaret, Strathclyde, Edinburgh, and Aberdeen Universities) The notion of how users can be led to interpret and compare the ultrasound images in the database will be explored and discussed.
References
Ball, Martin J. 1991. Computer coding of the IPA: Extensions to the IPA. Journal of the International Phonetic Association 21, 36-41.
Duckworth, Martin, George Allen, William J. Hardcastle & Martin J. Ball. 1990. Extensions to the International Phonetic Alphabet for the transcription of atypical speech. Clinical Linguistics and Phonetics 4, 273-280.
Esling, John H. 1996. Pharyngeal consonants and the aryepiglottic sphincter. Journal of the International Phonetic Association 26, 65–88.
Esling, John H. 1999. The IPA categories ‘Pharyngeal’ and ‘Epiglottal’: Laryngoscopic observations of pharyngeal articulations and larynx height. Language and Speech 42(4), 349–372.
Esling, John H. 2005. There are no back vowels: The laryngeal articulator model. Canadian Journal of Linguistics 50, 13–44.
Esling, John H. 2010. Phonetic notation. In William J. Hardcastle, John Laver & Fiona E. Gibbon (Eds.), The Handbook of Phonetic Sciences, 2nd ed. Oxford: Wiley-Blackwell, 678-702.
Moisik, Scott R. 2013. The Epilarynx in Speech. PhD dissertation, University of Victoria.
Moisik, Scott & Bryan Gick. 2013. The quantal larynx revisited. Proceedings of Meetings on Acoustics 19(060163).