
3660 阅读 2020-02-07 16:06:32 上传
Determination of glottal open regions by exploiting changes
in the vocal tract system characteristics
Ravi Shankar Prasad a)
International Institute of Information Technology, Hyderabad, India
B. Yegnanarayana EEE Department, BITS-Pilani Hyderabad Campus, Jawaharnagar, Hyderabad 500078, India
(Received 22 August 2015; revised 17 May 2016; accepted 28 June 2016; published online 27 July 2016)
This paper presents an approach to determine the open phase region of a glottal cycle based on changes in the characteristics of the vocal tract system. The glottal closing phase contributes to major excitation of the vocal tract system. The opening phase affects the vocal tract system characteristics by effectively increasing the length of the tract, due to coupling of the subglottal region. To determine the glottal open region, it is necessary to estimate the vocal tract characteristics from the segment with subglottal coupling. The proposed method derives the dominant resonance frequency (DRF) of the vocal tract system at every sampling instant, using a heavily decaying window (HDW) for analysis. The DRF contour transits to lower frequencies during glottal open region, when compared to the glottal closed region. The open region, within the glottal cycles from voiced speech segment, is extracted using the HDW method. The results are compared with the open region derived from the electroglottograph (EGG) signals and speech signals. The results show that the proposed method based on DRF contour, derived from the speech signals, seems to C perform better than the methods based on EGG signals. 2016 Acoustical Society of America. [http://dx.doi.org/10.1121/1.4958681]
I. INTRODUCTION
Voiced speech is produced due to vibration of vocal folds at the glottis. The vibration characteristics of vocal folds determine the shape of the glottal pulse in each cycle. These vibration characteristics depend on the mass and tension of the vocal folds, and also on the pressure from the lungs. The vibration characteristics are affected involuntarily due to coupling of the supraglottal vocal tract system with the subglottal part. They can also be controlled voluntarily by the speaker, as in the production of expressive speech. Typically, the period of a glottal cycle consists of four phases, namely, closing phase, closed phase, opening phase, and open phase. These phases have different effects on the response of the vocal tract system, i.e., in the resulting speech signal.
The different phases of a glottal cycle are mostly studied in terms of electrical impedance across the vocal folds. The electroglottograph (EGG) signal gives a measure of this impedance in terms of current flow across the folds.1,2 The larger amplitude of the EGG signal indicates higher impedance value, which corresponds to the open phase of the glottal source. In the closed phase, the impedance values are always lower, and hence the EGG signal has low amplitudes, since the skin has higher conductivity than open air. Since the closing phase of the glottis is generally abrupt, the derivative of the electroglottograph (dEGG) signal exhibits a sharp impulse-like behavior during closure. In such a case, we may interpret the behavior of glottal closure as an instant property. The time instant corresponding to this impulse is called the glottal closure instant (GCI).3 Glottal opening phase is relatively slower phenomenon without any impulselike excitation, and hence cannot be interpreted as an instant property. Sometimes a weak impulse-like behavior with opposite polarity is seen between two successive GCIs in the dEGG signal. The location of this impulse is attributed to the glottal opening instant (GOI).3,4 This demarcation is mostly used for defining the closed phase region, which is generally understood as the region between GCI and the following GOI. It is to be noted that the EGG signal does not contain any information about the glottal width or glottal area in the open region, since the contact between the vocal folds is not maintained anymore.5
Studies on the glottal source have focused mainly on determining the GCI and GOI, by suitably defining the latter depending on the context of the study. Most of the studies interpret GOI as a characteristic of the excitation source.6–9 It is a well known fact that there is no universally agreed definition of GOI. Following are three definitions of GOI for different applications:6
• GOI corresponds to an instant at the end of the glottal closed phase, when an increased residual error is observed in the linear prediction (LP) analysis of speech. This definition is utilized to define the closed phase region for covariance LP analysis.10
• GOI is the maximum derivative of the EGG signal between successive GCIs, corresponding to maximal rate of change of glottal conductivity, and not the airflow. This definition is used to assess the open quotient (OQ) in pathological speech.11
• GOI is the point at which the amplitude of the EGG waveform is equal to a percentage of its maximum value within a cycle. This definition is utilized to describe the glottal duty cycle by calculating either the closed or the open quotient.12
A brief review of some recent attempts made in the study of the glottal source characteristics in terms of GCI and GOI is presented here. Methods for determining the GOI rely mostly on the identification of GCI, and then decide upon a suitable duration for the open phase, based either on a fixed value or on a fixed ratio of the pitch period.13 Other methods generally employ visual inspection (stroboscopy) or glottal inverse filtering (GIF) techniques to examine the glottal opening and open phases. The GIF is usually implemented using closed phase inverse filtering (CPIF), assuming an all-pole model for the vocal tract system.14 Another implementation uses the digital all-pole (DAP) modeling technique to improve the estimation of the vocal tract formants.15,16 The CPIF is an effective method to analyze source and system components, but it suffers from the difficulty in identifying the GCI and GOI, to compute the closed phase covariance function for the LP analysis. A general approach to alleviate the problem requires employment of a second channel for source characterization such as the EGG signal. A more reliable method to perform the CPIF was proposed based on the auto-regressive moving average (ARMA) modeling of speech signals.17 ARMA modeling helps to eliminate the pitch related factors to obtain better spectral matching as compared to the frame-based techniques. A new technique, called the iterative adaptive inverse filtering (IAIF), was proposed.18 This technique estimates the excitation component with a two step iterative procedure, using LP analysis of different orders in cascade, to cancel the effects of vocal tract. Another method to estimate the source-filter components was proposed based on mixed phase models for speech analysis.19 This method attempts to separate the minimum and maximum-phase components of the speech signal, which involves using an anti-causal allpole filter to resolve the magnitude and phase information related to the glottal source. The two approaches for this type of signal modeling are based on the zeros of z-transform (ZZT) or the complex cepstral decomposition (CCD) technique, either of which being functionally equivalent.
The Dynamic programming projected Phase Slope Algorithm (DYPSA) uses the phase slope function of the LP residual signal and N-based dynamic programming (DP) to identify the GCIs from the given speech signal.20 The GOIs are then identified using an energy-based cost function. The Yet Another GCI/GOI Algorithm (YAGA) uses wavelet analysis along with group delay function and N-based DP over the glottal source signal estimated using IAIF.6 Another method uses a mean-based signal derived from LP residual to demarcate GCIs/GOIs. 21 Several other approaches for the identification of GOIs aim at defining a point of singularity between successive GCIs for source (EGG or LP residual) signals, using wavelets and multilevel decomposition techniques.3,4,22,23
Several studies have been carried out over these source estimation techniques to examine their performance for different types of speech signals, speakers and voice qualities, and also to examine robustness for different levels of noise.7,8,24–26 A general way to assess the performance of such techniques involves comparison of certain time/frequency parameters. These parameters help in quantifying the variable nature of the excitation signal in numerical form. The open quotient (OQ) is one such measurement which is defined as the ratio of the open phase duration and the period of a glottal cycle.27 Another parameter, called the normalized amplitude quotient (NAQ), helps in quantifying time based features of the glottal flow representation of the voiced source.28 A comparative study of different source estimation techniques is carried out using synthetic as well as natural speech signals.8 This study compares the estimates for source parameters like OQ and NAQ along with the spectral distortion measure for different voices. Another study compares the OQ computed from different techniques for natural and synthetic speech signals for different voice qualities (breathy, modal, and tense).7 The study compares StrikLF,25 YAGA,6 and a newly proposed artificial neural networks-open quotient (ANN-OQ)7 techniques against the reference values obtained from EGG signals using singularity in EGG by multiscale analysis (SIGMA)3 algorithm. The ANN-OQ uses Mel-frequency cepstral coefficients (MFCC) as input parameters for a two-layer perceptron network to train on natural speech signals to compute OQ values. Another study compares the glottal flow signal obtained from synthetic models of speech, based on the difference between the first and second harmonics (H1ÀH2) in the spectrum of the inverse filtered speech signal.29 The parameter H1-H2 is identified as a spectral correlate for detecting the glottal open region.
It is important to note that most of these methods for modeling the source component in speech, described in the previous paragraph (Sec. I), do not address the issue of the effect of glottal source on the vocal tract system. It is obvious that different phases within the period of a glottal cycle affect the resulting speech signal differently. In particular, the impulse-like glottal airflow produces speech as the response of the supraglottal vocal tract system in the closed phase region. The opening phase leads to a change in the vocal tract system by coupling the supraglottal and the subglottal tracts. The gradual nature of the opening phase at different levels (depths) of the glottis leads to difficulty in precisely determining its influence on the response of the vocal tract system. However, when the glottis is open in such a way that the supraglottal vocal tract is coupled to the subglottal region, the resultant vocal tract has different dimensions in comparison with the vocal tract dimensions in the closed phase region. In this paper, we intend to study the effect of this dynamic coupling of the vocal tract system within a glottal cycle in order to determine the glottal open region. It is to be noted that the present study attempts to interpret the transition from closed to open region in terms of changes in the vocal tract system, rather than changes in the excitation characteristics.
Attempts were made previously to exploit the changes in the vocal tract characteristics for determining the events in the glottal cycle, especially the glottal closure instants,from the speech signal. For example, in Refs. 30 and 31 the authors proposed methods to detect the abrupt change in the short-time spectral characteristics of the speech signal within a pitch period. The short-time spectral characteristics are expected to capture the variations in the characteristics of the vocal tract system within a pitch period, caused by the open and closed regions during glottal vibration. To detect the abrupt change from open to closed regions at GCI, two statistical methods for hypothesis testing were used. The first method uses the likelihood ratio between two alternative hypotheses for each possible transition instant, namely, “one change” at time “t” between two short-time autoregressive (AR) models, and “no change.”30,31 The likelihood ratio as a function of “t” will exhibit a sudden fall at the GCI, where the AR models before and after “t” will be significantly different from a single AR model over the analysis segment. In the second method the glottal events are identified from the abrupt jumps in the divergence between a short-term probability distribution function (PDF) and a long-term PDF. The PDFs are estimated using Gaussian AR assumption. During steady state, the shape of the divergence function is convex, whereas during the transient states the divergence jumps down, which helps in the detection of glottal events. Both these statistical analysis methods were tested on different types of speech segments such as vowels, nasals, voiced fricatives and voiced plosives. The GCIs were clearly identifiable in all these cases.
Note that both the above methods depend on spectrum estimation based on AR models. A low order model was used to improve the temporal resolution. But a low order AR model may give a smooth spectral envelope, thus reducing the ability to discriminate between open and closed regions. Moreover, an AR model tries to fit the entire spectrum of the windowed segment, and thus capturing only the gross short-time spectrum characteristics. Moreover, these methods focused mostly on detecting the GCIs.
In this paper we attempt to determine the glottal open and glottal closed regions, by exploiting the changes in the characteristics of the vocal tract system as in Refs. 30 and 31. The main difference between these regions is that, in the glottal open region the subglottal cavity is coupled to the supraglottal cavity, thus increasing the effective length of the vocal tract system. This increase in length lowers the frequency of the first resonance, compared to the frequency of the first resonance of the supraglottal cavity. Since most of the time the first resonance is the dominant one in the frequency response of the vocal tract system, we attempt to determine the lowest resonance frequencies, instead of using the complete short-time spectrum for detecting the glottal activity. Thus the main distinction of this work from the previous studies in Refs. 30 and 31 is in detecting the change in frequency of the dominant resonance, rather than the change in the short-time spectrum through AR models.
In order to determine the changes in the vocal tract system, spectral features are extracted at every sampling instant of time, using a recently proposed spectrum analysis method using a heavily decaying window (HDW) at each instant of time.32 Using this method, the dominant resonant frequency (DRF) is obtained at each sampling instant. The change in the dominant resonant frequency marks the change from glottal closed phase to glottal open phase.
The paper is organized as follows. Section II describes the events of the glottal source through EGG and dEGG signals. Section III reviews the HDW based analysis method for speech signals. Section IV explains the representation of glottal source characteristics using parameters derived from the HDW method. Section V presents an algorithm to identify the glottal open phase regions in speech signals using dominant resonance frequency (DRF), and the results are compared with other methods. Section VI presents a summary of the study reported in this paper.
II. EVENTS OF GLOTTAL SOURCE THROUGH ELECTROGLOTTOGRAPH (EGG)
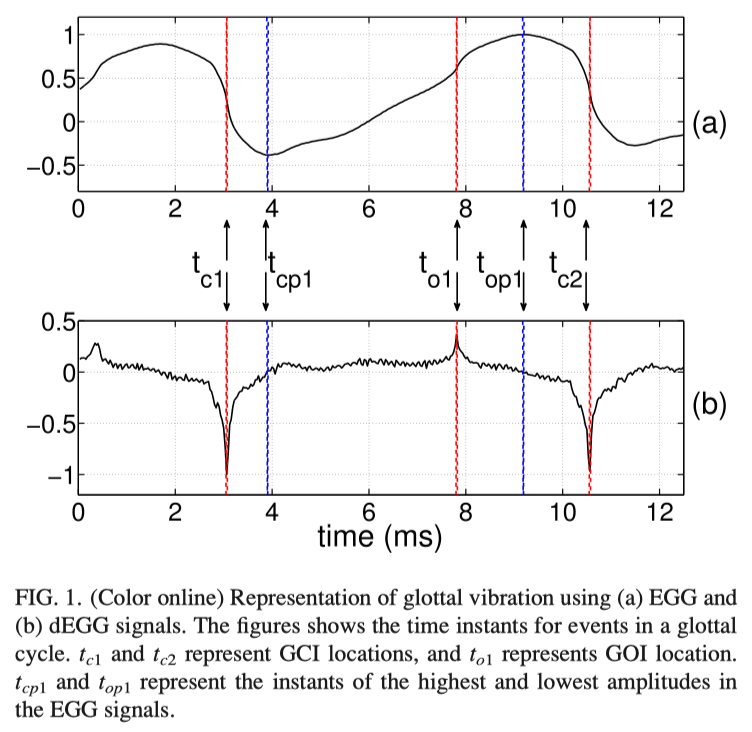
The EGG signal is a representation of the glottal source signal obtained using electroglottograph. It represents the changes in the impedance across the vocal folds. The positive and negative peaks in the dEGG signal are identified as the instants of opening and closing of the vocal folds, respectively.2 Figure 1(a) shows the EGG signal and Fig. 1(b) shows its derivative corresponding to a segment of voiced speech. The figure also shows the landmark events in a glottal cycle, corresponding to the closing and opening instants, and closed and open phases. The GCIs are marked as time instants tc1 and tc2 , and the GOI is marked as to1 . The closing phase is defined as the time duration between a GCI (tc1 ) and the instant where the EGG signal impedance reaches its lowest value (tcp1 ). Similarly, the opening phase is defined as the duration between to1 and top1 . As seen from the figure, the GOI is weaker in strength compared to the GCI, and it does not always appear as a peak. In many cases, identifying the GOI peak in the dEGG signal is difficult.3 Previous studies defined the region between a GCI and the following GOI (tc1 to to1 ) as the closed glottis region. Similarly, the region of the glottal cycle from a GOI to the following GCI (to1 to tc2 ) was defined as the open glottis region.
The sharp negative impulse-like behavior of the dEGG signal at GCI serves as a major excitation of the vocal tract system during production of voiced speech. Following this event is the closed phase region of the glottal cycle, which results in decoupling of the subglottal tract from the supraglottal region. This isolation results in a speech segment representing the resonance characteristics of only the supraglottal system. This glottal opening ensures a recoupling of the subglottal and supraglottal tracts. The change in the dimensions of the resonance cavity determines the change in the spectral behavior in the open phase of the glottal cycle. The periodic phenomenon of opening and closing of the vocal folds during a voiced speech segment results in the cyclic coupling and decoupling of subglottal and supraglottal cavities.
Source representation such as EGG signal may be adequate for identification of the glottal closure instant, but it is not useful to determine the glottal opening instant and glottal open phase region accurately. The GOI and glottal open region need to be studied in terms of changes in the vocal tract system caused by the changes in the dimensions of the resonance cavity. Analysis of short segments of speech is needed to determine the GOI and glottal open region in a glottal cycle, as described in Sec. III.
III. ANALYSIS OF SPEECH SIGNALS USING A HEAVILY DECAYING WINDOW
Glottal opening is a short duration phenomenon, which lasts for a fraction of pitch period. The glottal opening event does not always appear prominent in terms of excitation source characteristics, but leads to significant changes in the vocal tract system characteristics. The changes in the dimensions of the resonance tract result in changes in the spectral characteristics. The changes in the spectra occur in a fraction of a glottal cycle, and hence a high temporal resolution analysis is required to study these events. Spectrogram is a popular representation for analyzing the spectro-temporal characteristics of speech segments. A spectrogram is derived using short-time spectrum analysis of speech signals, and it provides a visual representation of gross features in speech at segmental and supra-segmental levels. However, due to bounds on the resolution in time-frequency plane, it is difficult to visualize spectral changes for durations less than a pitch period.
A new method of analysis is used to compute the spectra of speech signals with good temporal resolution.32 The method involves multiplying the speech signal with a heavily decaying impulse-like window. The windowed signal is given by
x[n] = s[n]w[n], (1)
where s[n] is the speech signal, and w[n] is the window function given by32

where N is the number of samples corresponding to a window size of l ms. This window provides significant weightage to the samples near the starting sampling instant. The first sample is set to zero to avoid division by zero. The analogy for this window function is derived from the zero frequency filtering (ZFF) method used for extracting the GCIs.33 The ZFF method is equivalent to filtering in the fre-quency domain using an ideal digital resonator 1/(1-z -1 )2 , centered at ω=0, i.e., at zero frequency. The operation is double integration, resulting in polynomial growth/decay in the time domain. Application of the time-domain operation on the signal, similar to ZFF, therefore imparts a polynomial type growth/decay in the frequency domain, similar to the time domain response in the ZFF method.33 The spectral characteristics can be highlighted by successive differentiation of the numerator of the group delay (NGD) function computed from x[n]. The NGD function is given by34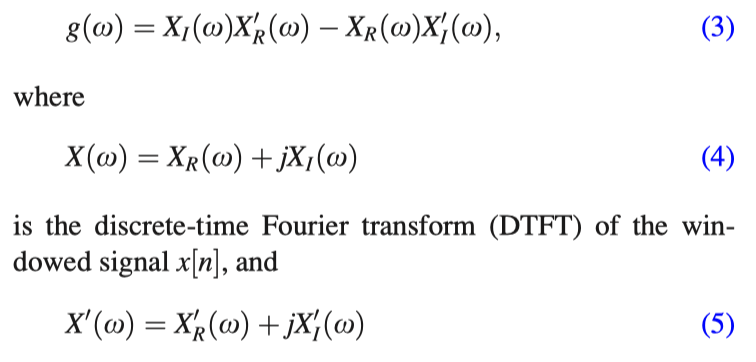
is the DTFT of nx[n]. The subscripts R and I denote the real and the imaginary parts, respectively.
The NGD spectrum is differenced twice to highlight the spectral features. The twice differenced NGD spectra shows the formant information clearly most of the time. But in a few cases (Fig. 7 in Ref. 32), the spectral peaks do not show up prominently in the twice differenced NGD spectrum.32 This can be corrected by computing the Hilbert envelope of the twice differenced NGD spectrum, and the resulting spectrum is called HNGD. The HNGD plots bring out the spectral peaks clearly, as discussed in Ref. 32.
Normally, short-time spectrum of speech signals is obtained using a window length of 20–30 ms. This gives a spectral estimate that reflects the average characteristics of the speech segment over the duration of the window. The spectrum obtained using these methods also suffers from the ripples caused by the truncation effects of the window. The proposed impulse-like window function in Eq. (2) helps to obtain spectral information corresponding to the instantaneous spectral response of the vocal tract system.
The peaks in the HNGD spectrum correspond mostly to the resonances of vocal tract system. The peak with highest amplitude corresponds to the strongest resonance caused by the effective length of the vocal tract system. We call this resonance as the dominant resonance, and the corresponding frequency as the dominant resonance frequency (DRF).35 The effective length of the vocal tract system will be higher in the open phase region due to coupling of the subglottal and supraglottal tracts. This results in significant lowering of the DRF in the open phase region in comparison with the DRF in the closed phase region. The following section explains the significance of DRF for extracting the features of the glottal source.
IV. GLOTTAL SOURCE INFORMATION FROM DRF
This section discusses the features of glottal source derived from the characteristics of the vocal tract system. As mentioned earlier, the effect of opening of the vocal folds can be observed predominantly in the characteristics of the vocal tract system. During opening of the glottis, the supraglottal cavity is coupled with the subglottal cavity, resulting in a longer tract. This vocal tract is shunted at the glottis during the closed phase of the glottal cycle, resulting in a shorter length of the tract. These changes in the length of the cavity are reflected in the spectrum as changes in the frequency of the corresponding dominant resonance. Previous studies have also reported that glottal opening causes a change in the location and/or bandwidth of the first formant.36 But these studies could not capture the changes well, due to limited temporal resolution of the spectrum resulting from the analysis methods.37 The changes in the vocal tract response can be observed only if the spectral information can be derived with high temporal resolution using small (less than the pitch period) segments of speech. Methods using short-time AR models were applied for detecting the GCI. These methods cannot be applied for detecting the glottal open region as the temporal resolution of the spectral details of the AR models is not adequate to detect the change from closed to open region. The analysis based on the heavily decaying window provides spectral details at each sampling instant of time with good frequency resolution. The DRF is computed from the HNGD spectrum by identifying the strongest resonant peak. The spectrum is smoothed using a three-point median filtering, and the peak locations are identified at the zero-crossings of the differenced HNGD spectrum. The zero crossing location corresponding to the strongest peak is chosen as DRF. The DRF contour obtained from the HNGD spectra provides the desired one dimensional representation of the vocal tract system characteristics, and thus can be utilized for demarcating the open and closed phases in a glottal cycle.
A. DRF in different phases of a glottal cycle
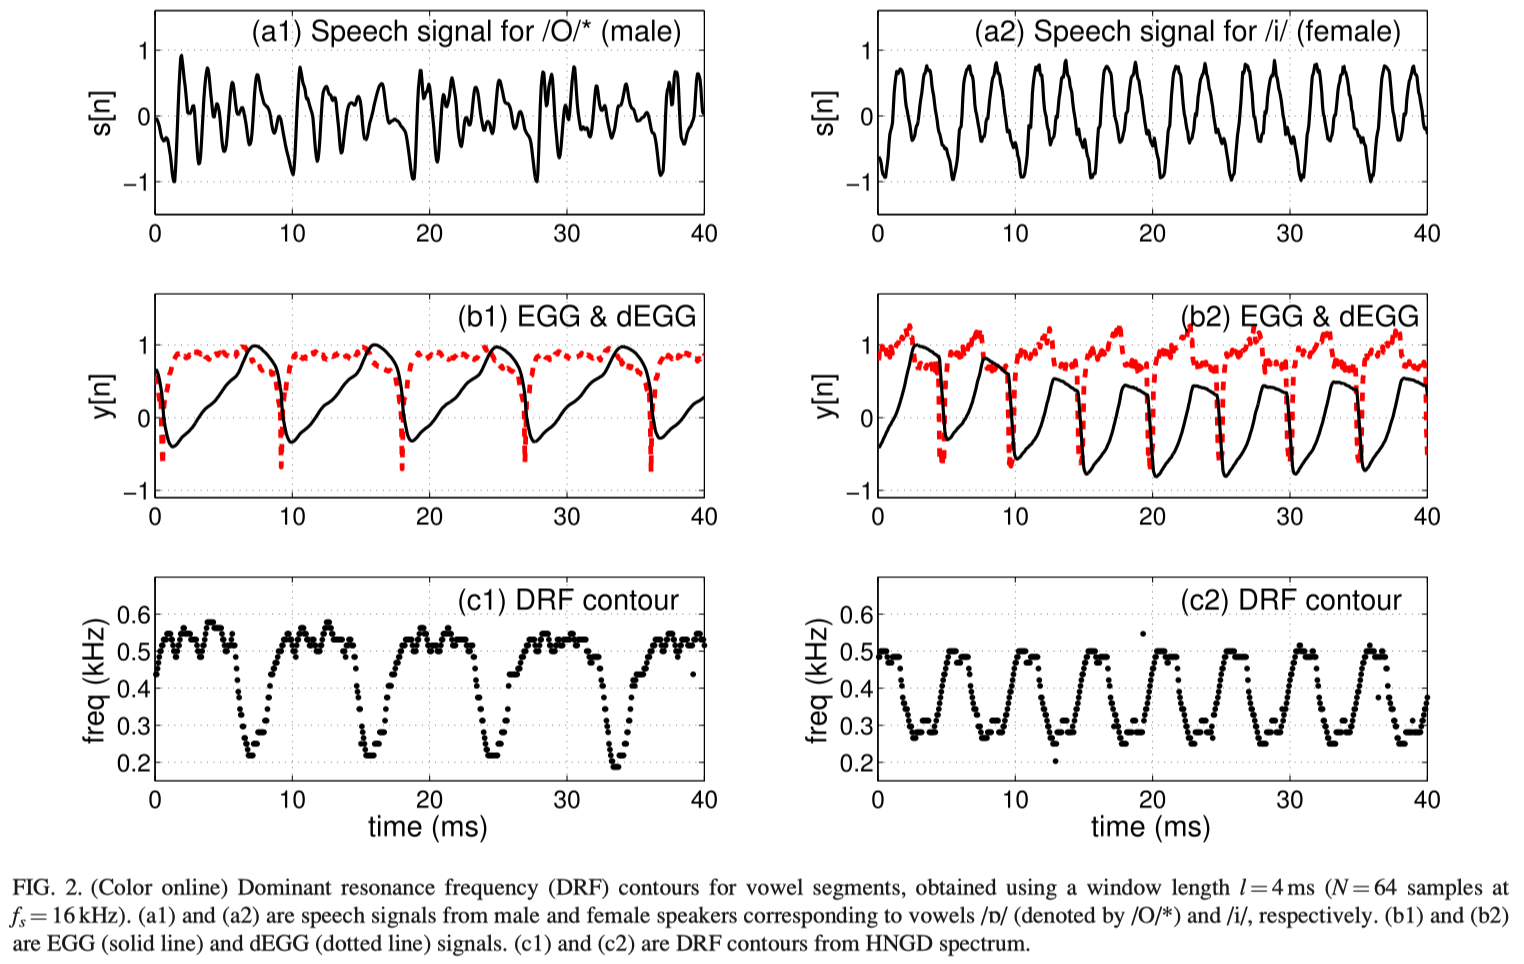
The DRF representation captures the behavior of the dominant cavity in the production of voiced speech segments. Figure 2 shows speech signals, spoken by male and female speakers, and the DRF contours derived using a 4 ms window for the analysis. Figures 2(a1) and 2(a2) show the speech segments of male and female speakers, for vowels /`/ and /i/, respectively, and Figs. 2(b1) and 2(b2) show the corresponding EGG and dEGG signals. The EGG and the dEGG signals are aligned to show that the GCIs correspond to the rapid fall in EGG signal. Figures 2(c1) and 2(c2) show the frequency locations of the dominant resonance derived from the HNGD spectra. Comparing the EGG and DRF contours, it can be seen that DRF contours drop in frequency in the regions where the EGG values are high. The values of DRF are high in the closed phase regions where the EGG values are low. This is true for most voiced regions, independent of speakers.
Figures 2(c1) and 2(c2) show that significant changes occur in the DRF values around the GOI (positive peak in the dEGG signal). The instant of transition of the values of the DRFs from higher frequency to lower frequency can be attributed to the coupling of the subglottal cavity with the supraglottal cavity. The nature and extent of the transitions vary for different segments. The transitions of DRF in Fig. 2(c1) are larger (300–350 Hz) and abrupt compared to those in Fig. 2(c2), where it is somewhat gradual. An abrupt transition may occur due to sudden change in the production characteristics from closed to open phases. A gradual transition can be attributed to the effects of the size of the analysis window in relation to the pitch period, which is the case in Fig. 2(c2). The transition around GCI appears gradual in nature as compared to the transition due to glottal opening. This is due to the finite duration (4 ms) of the analysis window. The dominant spectral characteristics are affected as soon as the GCI portion is included in the heavily decaying analysis window. The DRF contour gradually transits to higher frequencies as the analysis window is shifted, due to combined effect of the glottal open region and the following GCI.
The effect of the window duration is illustrated in Figs. 3(b)–3(e), which show the DRF contours obtained using analysis window duration varying from 5 to 2 ms. A longer analysis window results in a smoother DRF contour compared to smaller windows. As the duration of the analysis window is decreased, more fluctuations occur in the DRF contour due to truncation effect of the window. But the characteristics of the opening and closing of the source can still be observed in the DRF in all cases. Similar patterns of DRF contours are observed for all voiced speech segments, including nasals, nasalized vowels and voiced fricatives. Hence the proposed method works well for all voiced speech segments, as long as the window size is less than the pitch period.
The figure illustrates that the DRF contour obtained from the HNGD spectrum using an appropriate window size is useful to study the changes in the size of the resonance cavity during different phases in a glottal cycle. Like the EGG/dEGG waveforms, the DRF contour is also a one dimensional parameter, reflecting the different phases of the glottal source, with the advantage of computing it directly from the speech signal.

B. Changes in spectral structure during a glottal cycle
Previous studies have reported changes in the spectral characteristics of the vocal tract system during the open phase region within a glottal cycle.31,36,37 Dissipation of energy of the first formant was observed during the open phase of a glottal cycle. This phenomenon, termed as glottal damping, also results in shifting of the formant locations and change in their bandwidths.36,37 Analysis of the spectral characteristics of the voiced segments using the proposed method confirms this observation. Transition of the DRF to lower frequency takes place at the onset of glottal damping. Figure 4 illustrates this phenomenon through the HNGD spectra obtained from the proposed analysis using a 4 ms window at ten equidistant locations across a glottal cycle in a vowel segment. A three-point median smoothing is performed to reduce ambiguity in picking the location of the peak. The peak location is obtained from the positive to negative zero crossing of the differenced HNGD spectra.
Figure 4(a) shows the waveform of a segment of voiced speech signal corresponding to the vowel /`/. Figure 4(b) shows the DRF contour for the speech segment. Figures 4(c1)–4(c10) show the HNGD spectra normalized between 0 and 1, for the window locations at the time instants 1 to 10, marked in the speech waveform [Fig. 4(a)] and in the DRF contour [Fig. 4(b)]. The figure illustrates the change in the spectral structure within a glottal cycle. In Figs. 4(c1) and 4(c2), the dominant spectral peak occurs in the frequency band 600–650 Hz, since the analysis window is located in the closed phase region. As the analysis window approaches the opening instant [Fig. 4(c3)], an abrupt shift in the location of the dominant spectral peak is observed. The new dominant peak appears in the lower frequency band 250–300 Hz. This new resonance dominates for the entire duration of the glottal open phase, as can be seen in Figs. 4(c4) and 4(c5). As the analysis window approaches the instant of glottal closure, the dominant resonance gradually shifts to a higher frequency, as can be seen in Fig. 4(c6). The shift of the resonance peak from a lower frequency in the open phase region to a higher frequency in the closed phase region confirms the reduction in the length of the resonance cavity. The spectra computed at the window locations in the closed phase, as can be seen in Figs. 4(c7)–4(c10), show the dominance of higher resonance frequency.

Transition in the DRF from open to closed phase regions appear gradual, and thus it is difficult to mark the location of the transition to the closed phase. Note that it is difficult to observe the phenomenon of formant shift during the open phase of the glottal cycle using DFT or similar block processing methods for computing the spectrum.37 Since the proposed analysis estimates the spectral characteristics even for small (<5 ms) segments of speech, at every sampling instant of the signal, the resulting DRF contour represents the glottal source characteristics with good temporal resolution. In Sec. V, we develop an algorithm to demarcate the open phase regions in voiced speech using the DRF, and compare the results with some standard methods reported in the literature, namely, SIGMA and YAGA.3,6
V. IDENTIFICATION OF GLOTTAL OPEN REGIONS IN VOICED SPEECH SEGMENTS
Section IV B provides an insight into the acoustic manifestation of the opening of the vocal folds in the response of the vocal tract system. The DRF contour shows a consistent behavior of transiting to low frequency regions during the open phase of the glottal cycle. The transition at the opening instant can be abrupt or gradual depending on the glottal source dynamics and the analysis window length. However, the transition in the DRF from open phase to closed phase is generally gradual. The transition regions obtained for different sizes of the analysis window indicate that the midpoint of transitions may be a reasonable choice to determine the threshold for separating open and closed phase regions. In fact, the smoothed (2 ms mean smoothing) versions of the DRF contour for different analysis window sizes give approximately similar contours. Hence a threshold value in the middle of the smoothed DRF contour, for each glottal cycle, can be used to separate the open phase from the closed phase regions. To implement this, the DRF contours are normalized to the range 0–1 within each glottal cycle. Each glottal cycle region is identified using successive GCI locations determined by the ZFF method.33 Following are the steps to calculate the open phase region within each glottal cycle.
(a) Compute the HNGD spectrum at each sampling instant of the given voiced segment, using a heavily decaying window for analysis with a window length l=4 ms.
(b) Smooth the HNGD spectrum using a three-point median filter for facilitating peak identification.
(c) Pick the resonance peaks located at the positive to negative zero crossing of the differenced smoothened HNGD spectra.
(d) Obtain the DRF contour using the location of the strongest spectral peak, at each sampling instant.
(e) Smooth the DRF contour using a five-point median filter to remove outliers, if any.
(f) Obtain the GCI locations for voiced segments using zero-frequency filtering (ZFF) method.33,38
(g) Identify the region between two successive GCIs as the glottal cycle. Normalize the DRF contour within every cycle to 0–1 range.
(h) Use a threshold value of 0.5 over the normalized DRF contour to mark the glottal open regions. Segments of speech with DRFs below this threshold are identified as open phase region. The rest of the glottal cycle is identified as the closed phase region.
The choice of 0.5 as threshold will also reduce the uncertainties in the transitions for different sizes of the analysis window in the range of 3–5 ms and will result in the identification of the glottal open region, almost independent of the choice of the analysis window in this range.
The glottal open regions obtained using the proposed method are compared with the open regions derived using two other methods reported in the literature. We use the Carnegie Mellon University ARCTIC (CMU-ARCTIC) database39 to run experiments over the speech segments recorded for three [two male (BDL and JMK) and one female (SLT)] speakers. The database also contains the EGG signals to serve as reference. A set of 120 utterances is chosen to compare the durations of open vs closed phase regions derived using the proposed method and two other recently reported methods, namely, SIGMA and YAGA.3,6
The SIGMA algorithm uses multiscale analysis and group delay function over EGG signals to compute the glottal source parameters. 3 The YAGA algorithm utilizes the inverse filtered speech signal and group delay functions to identify singularities in the estimated source signals for the purpose of identifying the glottal opening instants.6 Programs for implementations of these algorithms were obtained from the Department of Electrical and Electronic Engineering, Imperial College London.40 The glottal open region for these algorithms is defined as the region between a GOI and the following GCI. These methods exploit the nature of discontinuities in the source signal to demarcate the instant of glottal closing and opening. The EGG signal, till date, is used as a reliable reference for glottal source parameter identification task, as it is collected directly from the speaker using electroglottograph. But, several studies consistently highlighted the drawbacks of using the small positive peak in the EGG signal as a cue for glottal opening.3,41,42 The nature of the sourcebased characteristics of glottal opening is often masked by the impact of additional mechanisms and physiological factors such as mucus effect or the breathy voice effect, or phonation-based noise.1
 Figure 5 shows the scatterplots for the durations of open and close phase regions obtained for several glottal cycles employing SIGMA, YAGA and the proposed method. The three columns correspond to three different speakers. The results using SIGMA algorithm are obtained from the EGG signals. The scatterplots of open vs closed duration points appear in clusters in Figs. 5(a1), 5(b1), and 5(c1) for the three speakers. The GOIs are selected using several energy and gradient based criteria, from a set of candidates obtained from multilevel decomposition of dEGG signal. The results for YAGA algorithm for the three speakers are shown in Figs. 5(a2), 5(b2), and 5(c2). The scatterplots of the open vs closed duration points in these figures appear in a relatively tight cluster as in the case of SIGMA algorithm. It is mostly because of the fact that the candidate GOIs obtained from the multilevel decomposition of the source signal are post-processed using dynamic programming algorithm to ensure the best alignment of open quotient values over successive glottal cycles. This operation constraints the possible locations of GOIs within close bounds, and therefore resulting in a tight cluster. Figures in the lower three rows [i.e., Figs. 5(a3)–5(a5), Figs. 5(b3)–5(b5), and Figs. 5(c3)–5(c5)] show the results using the proposed algorithm for three different window lengths (l¼ 5, 4, and 3 ms, respectively). It is interesting to note that the scatterplots for each speaker are similar for the three different window sizes, indicating that the proposed method is robust, and does not depend critically on the choice of the analysis window size within a range. The scatterplots of the open vs closed duration points obtained using DRFs over several glottal cycles exhibit more spread in the cluster, as compared to the results obtained using YAGA algorithm. Results obtained directly from the speech signals using the proposed method appear closer to those obtained using the SIGMA algorithm with the EGG signals, especially for the speaker BDL. The proposed algorithm does not use any post-processing techniques to refine the open region durations, which leads to more spread of the points in the figure. The straight-line obtained using simple regression analysis of these cluster points gives an idea of the average duration of the pitch period of the speaker. There are a few points occurring in the extreme values of open and closed duration values (i.e., OQ values in the ranges 0.1–0.2 or 0.9–1). Studies on analysis of OQ indicate that such regions occur during the onset and offset of voiced segments due to gradual build up of the glottal source characteristics.3 Different post-processing techniques can be used to identify and analyze such cases separately.
Extraction of features of the glottal source characteristics by the proposed method can help in distinguishing the voice and phonation quality for speakers. For example, speakers with breathy voice quality tend to exhibit a larger OQ when compared with the modal voice quality. This behavior can be noticed in Fig. 5(b3) for the speaker JMK, where most of the points in the cluster are located towards higher values of open phase duration, suggesting a breathy voice quality. This characteristic of the speaker JMK was also verified by perceptual listening tests.
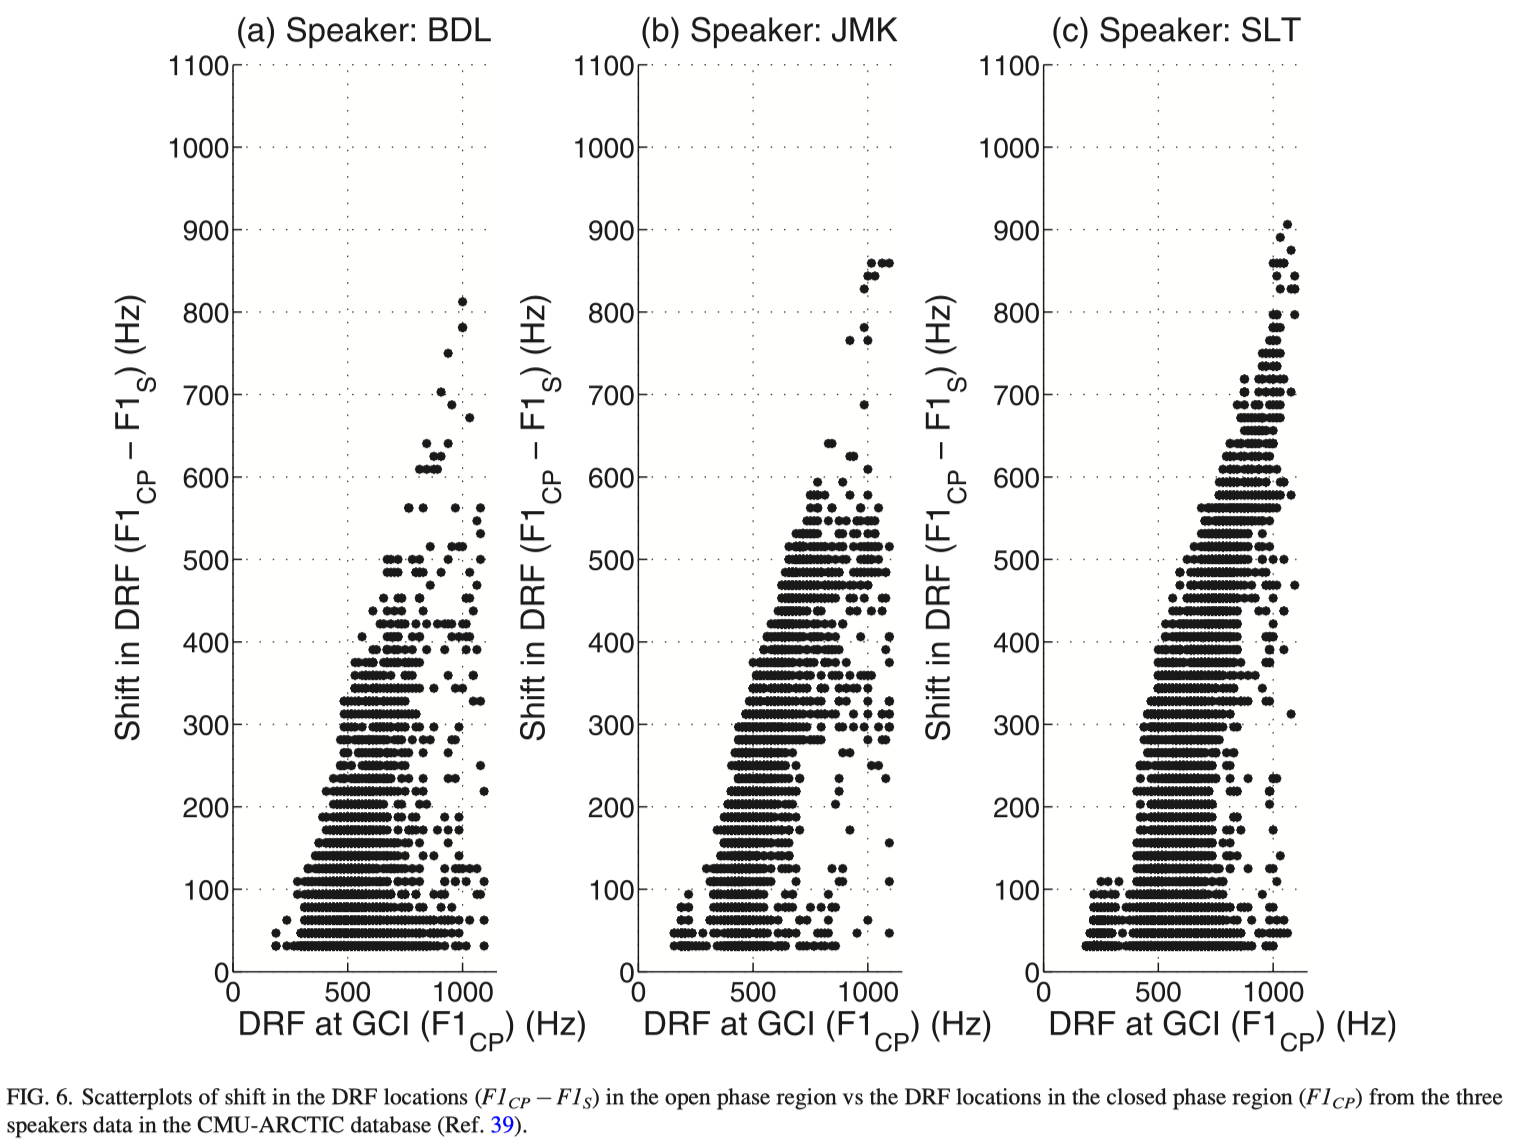
Studies on source-filter models of speech production assume independence of the characteristics of these two components, namely, the excitation source and the filter.43 The filter characteristics are usually studied based on the formant behavior during the closed glottis region.14 Researchers have observed that source-tract interaction resulted in shifting of the first formant frequency (F1) in glottal open region, with respect to its value in the glottal closed region.36 The study postulated that the shift of F1 in the open phase region is proportional to the F1 value in the closed phase region, implying that larger shifts in F1 are expected in segments with higher F1 values. Since the DRF corresponds to the first resonance peak (i.e., F1), we can examine the shift in the DRF during the open phase regions relative to the location of DRF in the closed phase region. The DRF in the open phase region is considered as the shifted F1 (say F1S ) and the DRF in the vicinity of GCI is considered as closed phase F1 (say F1CP ). The shift in F1 (i.e., F1CP –F1S ) is plotted against F1CP for several glottal cycles for the data of 3 speakers from the CMU-ARCTIC database, as shown in Fig. 6. The scatterplot for the three speakers indicate an approximate linear relation between the shift in F1 in the open phase and the F1CP . However, a wide range of shift of F1S can also be observed for similar values of F1CP .

Figure 7 compares the shift in F1CP versus the corresponding OQ values for multiple glottal cycles for the data of 3 speakers in the CMU-ARCTIC database. It is seen from the figure that the occurrence of the shift (F1CP –F1S ) in F1CP is almost independent of OQ. Note that OQ is a measure of the relative duration of the open phase within a glottal cycle, which reflects the voice quality of the speaker. The shift (F1CP –F1S ) in F1CP values, on the other hand, depend largely on the sound produced. These two factors therefore seem to be independent. However, studies have postulated that for a fixed glottal width, the shift in the formant frequency F1 increases in proportion to the open quotient OQ.37 The present observations indicate that this assertion may not be true.
VI. SUMMARY
This paper presented a method to examine the glottal source characteristics in terms of changes in the production characteristics during different phases within a glottal cycle. The speech signals are analyzed using a heavily decaying window at each sampling instant, as it provides spectral features with good resolution in time domain. The dominant resonance frequency (DRF) values are computed at every sampling instant from the HNGD spectra, obtained using the proposed method. The DRF contour provides a one dimensional representation of the dynamic vocal tract system. Thus the DRF contour is one useful parameter extracted from speech signals, to study the changes in the production system during a glottal cycle. The change in the effective length of the vocal tract due to the coupling of subglottal and supraglottal cavities, during the glottal open phase is captured by the transition in the DRF contour to relatively lower frequency values. The effect of the size of the analysis window was examined on the DRF contours. For smaller (<2 ms) windows, the DRF contour is not smooth, mainly because of the truncation effects of the window. The open regions obtained from the speech signals based on tracking the changes in the production characteristics were examined for three speakers in the CMU-ARCTIC database. The open phase duration using the proposed method appear closer to the ground truth obtained using the EGG signals. The results demonstrate the effectiveness of the DRF-based analysis to determine the glottal source characteristics.
The present analysis proposes a new definition of the glottal opening based on its influence on the vocal tract system characteristics. The proposed method can be used to analyze glottal source characteristics for several types of sounds, like laughter, cry, singing, falsetto, etc. The DRFbased representation of the dynamic vocal tract characteristics may provide complementary information with other types of source representations, and thus may help to improve our understanding of the glottal source.
1D. G. Childers, A. M. Smith, and G. P. Moore, “Relationships between electroglottograph, speech, and vocal cord contact,” Fol. Phon. Logopaed. 36(3), 105–118 (1984).
2D. G. Childers and A. K. Krishnamurthy, “A critical review of electroglottography,” Crit. Rev, Biomed. Eng. 12(2), 131–161 (1984). 3M. R. Thomas and P. A. Naylor, “The SIGMA algorithm: A glottal activi-ty detector for electroglottographic signals,” IEEE Trans. Audio Speech Language Processing 17(8), 1557–1566 (2009).
4A. Bouzid and N. Ellouze, “Local regularity analysis at glottal opening and closure instants in electroglottogram signal using wavelet transform modulus maxima,” in Eighth European Conference on Speech Communication and Technology (EUROSPEECH,03), Geneva, Switzerland (2003), pp. 2837–2840.
5P. Davies, G. Lindsey, H. Fuller, and A. Fourcin, “Variation of glottal open and closed phases for speakers of english,” Proc. Inst. Acoust. 8(7), 539–546 (1986).
6M. R. Thomas, J. Gudnason, and P. A. Naylor, “Estimation of glottal closing and opening instants in voiced speech using the YAGA algorithm,” IEEE Trans. Audio Speech Language Processing 20(1), 82–91 (2012).
7J. Kane, S. Scherer, L.-P. Morency, and C. Gobl, “A comparative study of glottal open quotient estimation techniques,” in Proceedings of the International Conference on Spoken Language Processing (INTERSPEECH, 13), Lyon, France (2013).
8T. Drugman, B. Bozkurt, and T. Dutoit, “A comparative study of glottal source estimation techniques,” Comput. Speech Language Processing 26(1), 20–34 (2012).
9J. Walker and P. Murphy, “A review of glottal waveform analysis,” in Progress in Nonlinear Speech Processing (Springer, New York, 2007), pp. 1–21.
10D. Wong, J. Markel, and A. Gray, Jr., “Least squares glottal inverse filter-ing from the acoustic speech waveform,” IEEE Trans. Acoust. Speech Signal Processing 27(4), 350–355 (1979).
11E. R. Abberton, D. M. Howard, and A. J. Fourcin, “Laryngographic as-sessment of normal voice: A tutorial,” Clin. Ling. Phonetics 3(3), 281–296 (1989).
12M. Rothenberg and J. J. Mahshie, “Monitoring vocal fold abduction through vocal fold contact area,” J. Speech Language Hear. Res. 31(3), 338–351 (1988).
13D. G. Childers and C. Lee, “Vocal quality factors: Analysis, synthesis, and perception,” J. Acoust. Soc. Am. 90(5), 2394–2410 (1991).
14L. R. Rabiner and R. W. Schafer, Digital Processing of Speech Signals(Prentice Hall, Upper Saddle River, NJ, 1978).
15A. El-Jaroudi and J. Makhoul, “Discrete all-pole modeling,” IEEE Trans.Signal Processing 39(2), 411–423 (1991).
16P. Alku and E. Vilkman, “Estimation of the glottal pulseform based on discrete all-pole modeling,” in International Conference on Speech and Language Processing, Yokohama, Japan (1994), pp. 1619–1622.
17Y. Ting and D. Childers, “Speech analysis using the weighted recursive least squares algorithm with a variable forgetting factor,” in International Conference on Acoustics, Speech, and Signal Processing (ICASSP ‘90), Albuquerque, NM (1990), pp. 389–392.
18P. Alku, “Glottal wave analysis with pitch synchronous iterative adaptive inverse filtering,” Speech Commun. 11(2), 109–118 (1992).
19W. R. Gardner and B. D. Rao, “Noncausal all-pole modeling of voiced speech,” IEEE Trans. Speech Audio Processing 5(1), 1–10 (1997).
20M. R. Thomas, J. Gudnason, and P. A. Naylor, “Detection of glottal closing and opening instants using an improved dypsa framework,” in Proceedings 17th European Signal Processing Conference, Glasgow, Scotland (2009), pp. 2191–2195.
21T. Drugman and T. Dutoit, “Glottal closure and opening instant detection from speech signals,” in Proceedings of the International Conference on Spoken Language Processing (INTERSPEECH ‘09), Brighton, UK (2009), pp. 2891–2894.
22A. Bouzid and N. Ellouze, “Open quotient measurements based on multiscale product of speech signal wavelet transform,” J. Elect. Comput. Eng. 2007, 62521.
23C. d’Alessandro and N. Sturmel, “Glottal closure instant and voice source analysis using time-scale lines of maximum amplitude,” Sadhana 36(5), 601–622 (2011).
24I. Arroabarren and A. Carlosena, “Glottal source parameterization: A comparative study,” in ISCA Tutorial and Research Workshop on Voice Quality: Functions, Analysis and Synthesis (2003).
25H. Strik, “Automatic parametrization of differentiated glottal flow: Comparing methods by means of synthetic flow pulses,” J. Acoust. Soc. Am. 103, 2659–2669 (1998).
26P. Alku, “Glottal inverse filtering analysis of human voice production-a review of estimation and parameterization methods of the glottal excitation and their applications,” Sadhana 36(5), 623–650 (2011).
27R. Timcke, H. von Leden, and P. Moore, “Laryngeal vibrations: Measurements of the glottic wave: Part 1. the normal vibratory cycle,” AMA Archiv. Otolaryngol. 68(1), 1–19 (1958).
28P. Alku, T. B€ackstr€om, and E. Vilkman, “Normalized amplitude quotient for parametrization of the glottal flow,” J. Acoust. Soc. Am. 112, 701–710 (2002).
29N. Henrich, C. d’Alessandro, and B. Doval, “Spectral correlates of voice open quotient and glottal flow asymmetry: Theory, limits and experimental data,” in Proceedings of the International Conference on Spoken Language Processing (INTERSPEECH ‘01), Aalborg, Denmark (2001), pp. 47–50.
30R. D. Francesco and E. Moulines, “Detection of the glottal closure by jumps in the statistical properties of the signal,” in First European Conference on Speech Communication and Technology (EUROSPEECH,89), Paris, France (1989), pp. 2039–2042.
31E. Moulines and R. Di Francesco, “Detection of the glottal closure by jumps in the statistical properties of the speech signal,” Speech Commun. 9(5), 401–418 (1990).
32B. Yegnanarayana and D. N. Gowda, “Spectro-temporal analysis of speech signals using zero-time windowing and group delay function,” Speech Commun. 55(6), 782–795 (2013).
33K. S. R. Murty and B. Yegnanarayana, “Epoch extraction from speech signals,” IEEE Trans. Audio Speech Language Processing 16(8), 1602–1613 (2008).
34M. Anand Joseph, S. Guruprasad, and B. Yegnanarayana, “Extracting formants from short segments of speech using group delay functions,” in Proceedings of the International Conference on Spoken Language Processing (INTERSPEECH ‘06), Pittsburgh, PA (2006), pp. 1009–1012.
35R. S. Prasad and B. Yegnanarayana, “Acoustic segmentation of speech using zero time liftering,” in Proceedings of the International Conference on Spoken Language Processing (INTERSPEECH ‘13), Lyon, France (2013), pp. 2292–2296.
36D. G. Childers and C.-F. Wong, “Measuring and modeling vocal source-tract interaction,” IEEE Trans. Biomed. Eng. 41(7), 663–671 (1994).
37A. Barney, A. De Stefano, and N. Henrich, “The effect of glottal opening on the acoustic response of the vocal tract,” Acta Acust. Acust. 93(6), 1046–1056 (2007).
38N. Dhananjaya and B. Yegnanarayana, “Voiced/nonvoiced detection based on robustness of voiced epochs,” IEEE Signal Processing Lett. 17(3), 273–276 (2010).
39J. Kominek and A. W. Black, “The CMU-ARCTIC speech databases,” in Fifth ISCA Workshop on Speech Synthesis, Pittsburgh, PA (2004).
40 Department of Electrical and Electronic Engineering, Imperial College London, http://www.ee.ic.ac.uk/hp/staff/dmb/voicebox/voicebox. html (Last viewed July 6, 2016).
41A. Bouzid and N. Ellouze, “Voice source parameter measurement based on multi-scale analysis of electroglottographic signal,” Speech Commun. 51(9), 782–792 (2009).
42J. P"erez and A. Bonafonte, “Automatic voice-source parameterization of natural speech,” in Proceedings of the International Conference on Spoken Language Processing (INTERSPEECH ‘05), Lisboa, Lisbon (2005), pp. 1065–1068.
43F. Gunnar, The Acoustic Theory of Speech Production (Mouton, the Hague, the Netherlands, 1960).