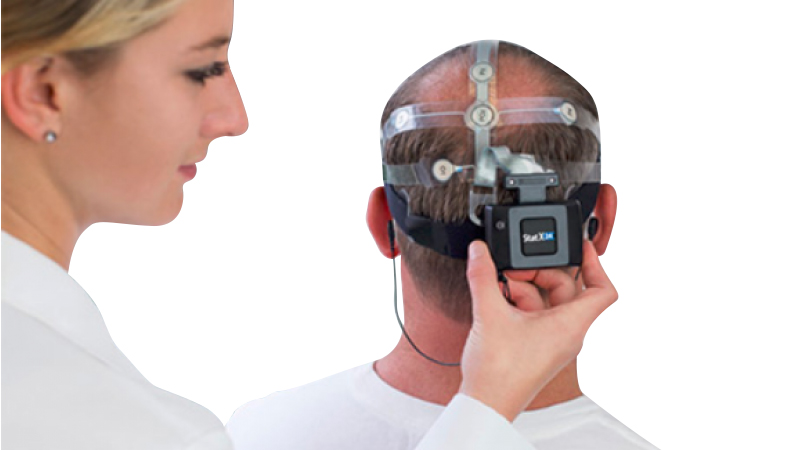

1531 阅读 2020-02-28 17:30:08 上传
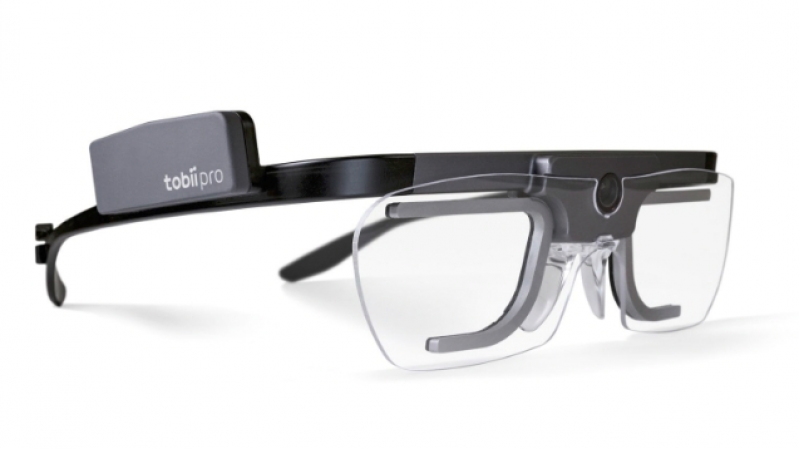
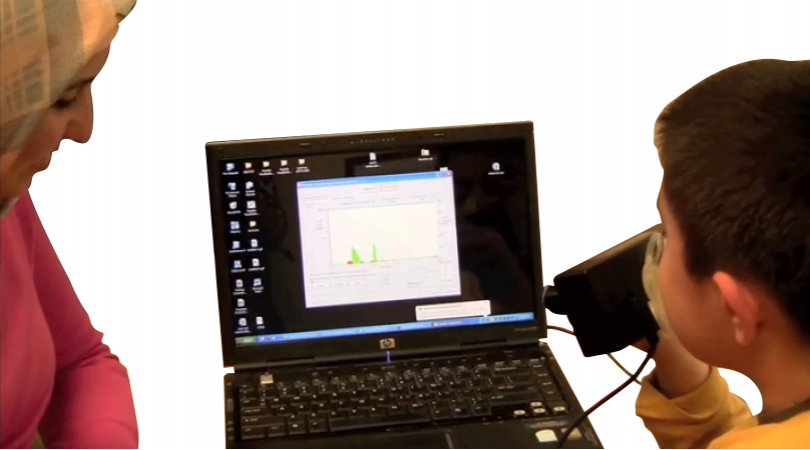
Hello,Welcome to this Tobii Pro video,which will provide an overview of the main features of tobii Pro lab,Tobii Pro lab is our versatile software for behavioral studies using tobii Pro eye trackers,Pro lab gives you the capability to combine eye tracking with various other biometric measures,from psychology experiments to consumer research,Pro lab expands the opportunities for understanding human behavior while making it easier than ever to design,execute and analyze your work,In this video the features of Pro lab when used in conjunction with any tobii Pro screen based eye TRACKER will be covered from the x 2 and x 3 series to the tobii force spectrum.Pro lab can also be used to analyze data from tobii Pro wearable eye trackers such as pro glasses 2.For details on specific features and functions for wearable trackers,Please see the separate video on Pro lab analyze addition,A new project can be created here,Types available as shown on screen. Now,The project overview area gives you the relevant high level Information about your project, including participate,timeline,and specific recording Information.You can also quickly see and creative.Types here.Enable the manual coding.Behavior,The design area shows all the time lines for the current project.When using a screen based TRACKER. This is where the study will be created.From importing stimuli to configuring calibration,The tools found here provide the functionality that enables customizing any study to your specific needs and specifications.Complex studies employing multiple stimuli line and time lines can be edited recently,Pro lab makes this possible through bach importing when working with stimuli,either individually or across multiple timelines.This makes it easy to change the position.Size a name of any stimulus.The ability to choose a variety of methods to advance from one stimulus to another provides a high level of flexibility in experiment design.not only are there multiple methods of advancement such as by key press or time of exposure.But multiple methods can be applied to the same stimulus,Curate timing of stimulus. Presentation is often of critical.And tobii pro lab can reliably present a stimulus for generations shorts 50 milliseconds and estimate with millisecond accuracy when the stimulus was displayed on the screen.Pro lab makes it easy to synchronize gaze data with data streams from other biometric devices,This is achieved by sending precise timing signals at the start of a stimulus station,This is done using tt onset market sent through the parallel port.These on Set markers can be configured automatically or customized to suit specific or advanced requirements.It is also possible to choose specific tracking modes tailored to special circumstances or specific.For example using the video calibration mode,enables a dedicated option to improve the likelihood of maintaining attention during the calibration process,This can be very helpful when working with infants for example.The record area gives you access to all the features needed to ensure everything is ready to capture data.The eye TRACKER card shows you at a glasses which TRACKER you're connected to,and in which mode it is operating.When clicked on,it can provide you with critical Information regarding the status of the selected TRACKER.This Information includes the real time gaze sample percentage for each individual,As well as the location of the participants eyes within the track box as both distance and position.These factors enable the experiment to understand and optimize the projected quality of the study set up and participants track ability.The TTL card displays the connection status of the parallel port,which is required for communication with biometric devices.The record area gives a great visual representation of the time lines there in the current project.and how many times each has been used during a study.This helps to ensure all required time lines are used,If a timeline has a mistake something needs to be changed.Clicking on the edit button will lead straight to the specified timeline in the design area to make the workflow easier and more efficient.If working on multiple screens,the targets green card can be used to identify the resolution of any connected.And the user to select the appropriate one.There is a moderator tool available,This tool allows the experiment to view the live gaze of the participant as well as get Information on the participants location and gaze sampling rate.The Information provided by this tool can serve as a diagnostic alerting the experiment as to when a participant moves out of range of the TRACKER.or if something is interfering with the data,An additional screen is needed to enable this feature.Only this means to monitors operating in extended desktop mode.The analyse area includes tools which allow for both quantitative and qualitative analysis and visualization of project data within the software.as well as the generation of metrics and data export it is possible to replay individual recordings to review process and mark them up for further analysis.The recording Information panel shows relevant recording Information about the currently viewed recording.The gazs data panel contains tools which allow the selection of different noise reduction filters and gaze class location settings.Enabling the selection of data from one or both eyes and calculation of fixation on.There are some aesthetic options as well to ensure that the data can be displayed in a way that is clear impact full and appropriate for the current project.With the gazs data chart it is possible to inspect the data quality as well as making the eye movement classification 100% transparent.But it can also be used in order to determine when I movements begin an end down to a single gaze sample,making it easier to see when events begin then end.Events and custom times of interest are used for segment in data encoding participant behavior.These ensure that relevant data is being analyzed,And both events and custom times of interest can be applied to visualization,as well as data and metrics exports.The visualization tap is used to create visualization such as heat maps or gaze plots.These are useful as a first stage analysis tool but can also be a very powerful way to visually communicate aspects of project findings,Different heat maps can be produced to show either whether participants look the most and the least,as well as the areas that were not seen at all.To gaze plot shows. The path of the participants gaze over the recording.It is possible to select which tons of interest and participants to include in the visualization,along with numerous other settings that allow both the heat map and guidebook to be customized in a way that best fits the project.Giving Complete control over the creation of visualization.The aly tab contains intuitive tools that allow the creation of areas of interest.These aly register when participants are looking at specific parts of the stimulus.Aly can be any shape or size.They can be copied and pasted in place on to other stimuli.This can save time and make the workflow more efficient areas of interest on the basis for further statistical analysis.when working with both metrics and data export.The metrics export tab enables to customize about statistical output of behavioral and gaze metrics into a standardized spreadsheet.Former for more in depth analysis in 3rd party software such as spssr or Matlab?Using the metrics export tool data can be pre processed on eye tracking specific metrics such as looking time and visitOr on behavior.Specific metrics, such as interval, duration, and event count.The data export tab allows export of all recorded data for further analysis in 3rd party software such as Matlab or octave.The exportable data includes gazs points gaze direction, pupil, as well as many others.The data is exported in a common spreadsheet format that can be opened and edited in numerous different applications.Thank you for watching this tobii pro video,For more Information help and other videos please visit tobii Pro.Com. See you next time.