
3784 阅读 2020-03-19 15:04:39 上传
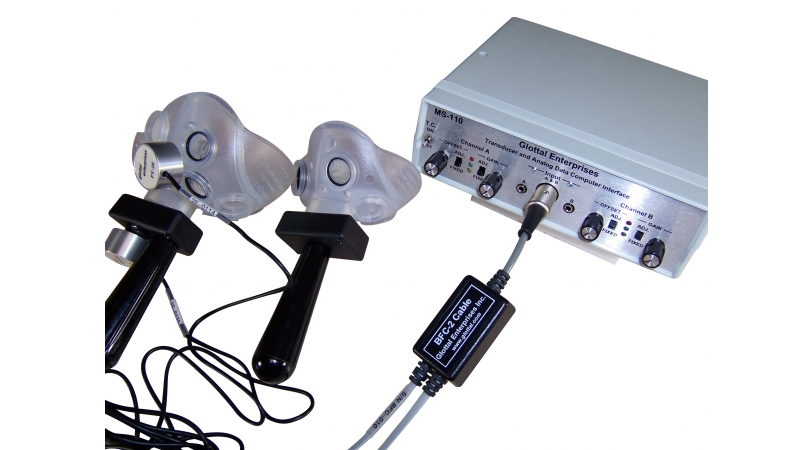
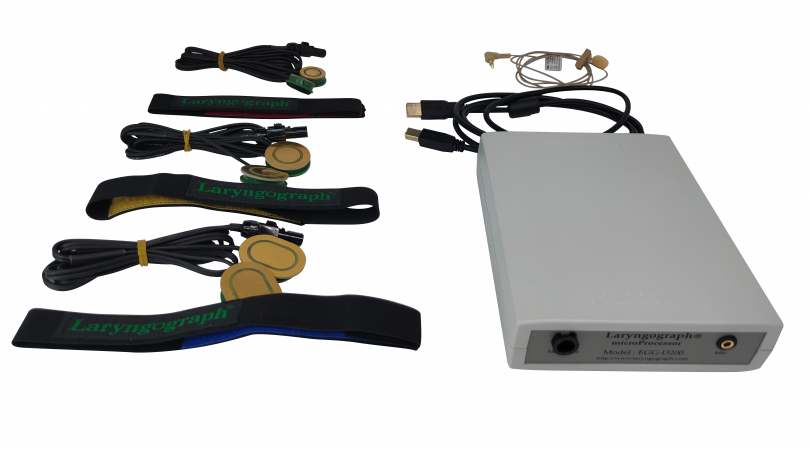
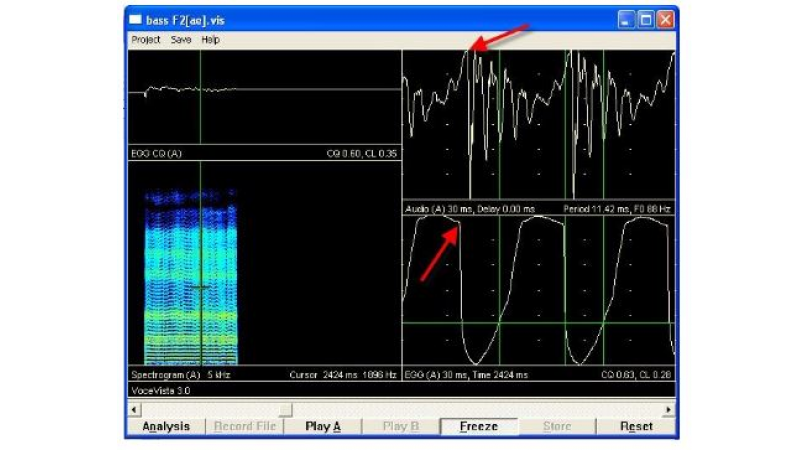
In this video,I want to show you how to use the EGG Display in VoceVista video Pro.Let's start by opening a sample file that trips with the application,going Help,Open sample file,and then choose file 11a,And then to make this more familiar to people who have used previous versions of VoceVista, click on settings profiles and shows the VoceVista lin layout,and also to view the entire content of the file,click on view and then Zoom out fully,So now I have my spectrogram on the left side giving me an overview of the entire file,And then wherever the green line is positioned,I have the spectrum on the right.Now this is a stereo file that has two tracks.One is the audio track, which is the left channel.And then I have the EGG track, which is the right channel.So the left channel sounds like this,and then the right channel, which is the EGG track, sounds like this.So you can notice that the distribution of the harmonics in the EGG is very uniform,They start loud and then each one is a little bit quieter than the previous ones.So if you're ever not sure which is the EGG,which is the audio,just look at the spectrum.The audio has a much more complex distribution of overtones,because the audio has already traveled through the vocal tract,where some frequencies are amplified by the resonance is in the vocal tract,and others are not so much.But the EGG doesn't have any resonance applied to it at this point,so it is very straight drop in intensity across the frequency range.There's another way in which he can switch the channel.and then clicking on recording options.And here you have settings currently in use for the channel display.And that's the same thing that you see here on the tube.So right now we're displaying the right channel the EGG,the audio. And that's what we want.If you make a new recording with the EGG, you can pick one of these options here to set how your hardware is configured.so here we have the spectrogram on the left and the spectrum on the right.Now let's turn on the actor EGG signal to do that. Click onoptions.And thenselect Analyzer View on this side,andselect EGG up here.And So here we have the display settings for the EGG.now let's enable the short term audio and EGG display,which is this view here,And also let's enable the EGG history which i'll talk about in a moment.So here at the bottom is the EGG signal and at the Top is the audio signal.Nowthe EGG actually works by having two electrodes placed on either side of the larynx, and then running a small current between the electrodes.And When the vocal folds come into contact there is more current that can flow through them.And that means at this point the curve is going up because there's more current flowing.And then at some point the vocal folds open again,and there's less current that flows through it and the signal goes down again.And this allows us to estimate when the vocal folds are closed and when they're open.Now when the vocal folds come into contact, they produce a loud bang.And this bang creates a sound wave that travels through the vocal tract,and then out of the mouth and to the microphone,And that's where we can record the audio signal. Here,there's a delay between the events in the vocal folds that create a sound, and then the sound wave that arrives at the microphone a little bit later.then you can see that there is no alignment between these two curves.But You can just click on the curve and change it around.And a good way to do this is to align the sharp rise here with a sharp rise here.And To do that, we havethe display of the derivative of the signal, which is the rate of change.So if you write click here,you can enable each of these four curves are turn them off,So this green line is the rate of change of the white line,which means when there's a peak in the green linethis is where the signal is rising most rapidly.And that's actually what we want to look at.And similarly for the audio signal the peak is here,and that means when its rising most rapidly here it's also rising most sharply here.And that's probably a good way to correlate these two events herewhere the sound is produced on here,where it arrives at the microphone filtered through the vocal track.So Right nowyou can see that the signal is starting to repeat itself once.So one period is the time between these two gray lines, we're showing about two periods here.To change the amount of time that is displayed ,You can simply zoom in and out of this view.And the zooming is done by using your mouse beer. Or mouse will gesture on your track bed or by using the one and two keys on your keyboard.So if you wanna use the keyboard, press 1 to zoom in, press 2 to zoom out,or use one of the other methods.When we look at the EGG we are mainly interested in when other vocal falls closed,And when are open Again.in one way of doing this is to draw an imaginary line across this curve,and then just measure where does it go above the line And where does it go below the line.as the close event and the open event.So here we have this line at 35% in relation to the entire height of the curve,Andthis gives us a contact quotient of 23%.The curve is above the orange line for 23% of the time,which is about a 4th,So this raises the question what is the correct value for this line.And the answer is there is no correct value,You can simply drag the criterion level,and then see what happens here. In the contact version history.It doesn't change dramatically but it changes a little bit depending on where I put the line.So this is totally arbitraryAnd If I look at other parts of the curve,it might be more dramaticWhat kind of change I get from putting the line very low or very high.So you can see the quality of the close quotient doesn't really change,but the individual values do change.And You just have to experiment a little bit or use a convention about what works best for you.Now, a better wayto measure the opening and the closing is to usethe rate of change or the derivative.So if I enable this again,we can see there's a peak here where the signal is rising more strongly,minimum here where the signal is dropping most rapidly,So if I if I have good values for thisthe EQ method to use these two events. So now it will always pick the maximum of the derivative as the close event,and the minimum of the derivative as they're open eventAnd you can see that this changes the history here to be a little bit more noisybut it's still basically a very good reading.So now I don't have the criterion line any more, and I don't have to guess,where I should set it.to give me a better estimate of the close and open event.So should we always use this method?Maybe let's look at another sample file to get a broader perspective on thisSo open the file, 11bAnd to understand better what's going onlet's turn on the egg maximum and minimum in this display.So you can see here that the peak of the derivative is relatively smooth,but the minimum of the derivative is kind of noisy.And So that's a problem with this recording,that the minimum is kind of buried in noiseThere's not really a clearwell defined minimum across the entire stigmaAnd that's why it jumps aroundComparing this with this one Here.you can see that the minimum is bunch more defined, and it doesn't jump around quite as much.So to get a more stable reading here we have two choices,We can go back to the criterion level methodThen we get a nice and smooth curve.Or we can use a mixture of these two methods usingthe peak,of the derivative for the closing event,and then using the criterion level line of the opening event.the the opening staysbecause it's always using the derivativeBut the closing is using the part where the curve intersects the criterion level lineAnd that gives me kind of combination of two methods.and this concludes my tutorial. So I have shown you how to pickthe channel of your stereo recording, which contains audio and EGG.then i've shown you how to enable and disable the various parts of the singer.I've shown you how to change the delay by moving the curve around here.And i've shown you how to use the criterion levelor the maximum and minimum method to pick out what the contact portion is.To review the different settings that I have talked about, you can alwaysbring up the settings page and then click on the help button down hereAnd this will bring up the online helpwhich explains everything i've shown you so far.