
2098 阅读 2021-03-23 09:33:18 上传
以下文章来源于 言语语言病理学
CEUS是GIS届公认的好期刊,一年约刊文100篇,北大的刘瑜教授是该期刊第一位中国籍的副编辑。本文撰写于博士入学前的暑期,是我的第一篇顶刊,这里分享给大家审稿经历与修改说明,约20多页Word,自认为花了很多工夫,希望对读者有启发与帮助。一审大约3个月,二审大约2个月,速度较快。
Original Manuscript ID: CEUS-D-20-00494
Original Article Title: “KE-CNN: A new social sensing method for extracting geographical attributes from text semantic features and its application in Wuhan, China”
To: CEUS Editor and anonymous reviewers
Re: Response to reviewers
Point 1: The paper presents a method of extracting geographical attributes from social media data, in particular Chinese Weibo data related to COVID-19, while "geographical attributes" are not clearly explained in this paper. The topic addressed is new, but authors failed to clearly describe what problems this study was trying to address and what new contributions are made through the proposed method and analyses. The paper lacks of proper, in-depth review of published works, especially those related to information extraction from social media data using spatiotemporal and semantic approaches, published over the last 5 years. The brief review included in the introduction section is quite broader and un-focused.
Response 1:
Thanks for the suggestion and we think your comments are reasonable. The article's introduction and related work have been substantially revised. You could view the changes in the corrected version.
The research questions this paper answers are as follows:
(RQ1):What interesting conclusions can be drawn about the COVID-19 pandemic based on social media data using social sensing?
(RQ2):Considering the increasingly stringent privacy protection on social media platforms, how can the geographic attributes of social media texts be inferred from the frequency of word occurrence and co-word relationship when there is no address description in the text?
Research question 1 is some applied contribution and research question 2 is our methodological contribution. Corresponding to the research question, our main contributions are twofold:
● From a methodological perspective, this paper proposes a convolutional neural network geographic classification model based on keyword extraction and synonym substitution (KE-CNN) which could determine the geographic attribute by extracting the semantic features from text data.
● From an application perspective, this paper achieves non-contact pandemic social sensing by capturing the spatial behaviors of a large number of people, and construct a co-word composite network to obtain public opinion information.
In response to your question about the definition of geographic attributes, we explain as follows and this part of the explanation was placed in the Introduction section of the revised draft:
Geographical attributes refer to the location information embedded behind social media texts, and this location information is not detailed address information, but the functional type of the address. Unlike the traditional methods of extracting detailed location information from texts based on dictionary matching or named entity recognition, this paper proposes a neural network-based approach to discover the geographical semantic information embedded in texts. Even if the relevant words describing the location do not exist in the social media text, our method can still infer the type of address (Geographical attributes) behind the words from their probability of occurrence in the text or the probability of co-occurrence of different words. Our method treats each word and the combination between different words as an observation, and makes inferences based on these observations.
About the question “lacks of proper, in-depth review of work especially those related to information extraction from social media data using spatiotemporal and semantic approaches”, we add the related work section. We first present a review of recent works related to the topic " information extraction from social media data using spatiotemporal and semantic approaches" and then discuss the advantages and disadvantages of the algorithms used in these works. Afterwards, we propose our solution.
Facing the social media data acquired by social sensing, the most commonly used is the latent Dirichlet allocation (LDA) topic modeling approach, which parses social media texts into a three-layer structure of word-document-topic. Some researchers argue that we can take each document feature as an individual sensor (In our paper, the corpus is represented by a high-dimensional matrix after being trained by deep learning. Each dimension of the matrix can be considered as a sensor.) to measure a signal of (possibly abstract, unknown, or meaningless) geographic semantics (Sengstock and Gertz, 2012). Topic models represented by LDA can automatically discover the implied topic structure from a large number of documents without prior knowledge. (Huang et al., 2018) use geotagged tweets based on clustering algorithms with topic models to study the spatio-temporal pattern of events and identify semantic content. (Resch et al., 2018) similarly used topic models to reveal the spatio-temporal characteristics of catastrophic events and thus perform risk assessment. The same approach is used in the study of urban functions, where each POI is considered as a word and the POIs around the sampled location are considered as a document, and different functional attributes are assigned to the sampled location (Gao et al., 2017). In addition to this, some scholars have explored the spatio-temporal and semantic clustering of Twitter data using unsupervised neural network methods (Steiger et al.,2016). (Wang and Stewart, 2015) have studied the extraction of semantic information from web documents (news reports) by constructing ontology models with gazetteers. Studies have shown that social events can be perceived in temporal, spatial, and textual dimensions from social media data (Zhu et al., 2019), and some research treats these three dimensions as a tuple, and knowing two elements of the tuple allows one to infer the other elements (Diaz et al.,2020).
In terms of extracting geographic attributes from social media texts, the aforementioned studies have two shortcomings; LDA methods are an unsupervised classification model and the extraction results of urban function differ from the actual classification criteria; in addition to this, these methods require a library of pre-prepared place names and identify them in social media texts (Di Rocco et al., 2020). In this paper, we propose a convolutional neural network geographic classification model based on keyword extraction and synonym substitution (KE-CNN), which could overcome the two previously mentioned drawbacks and extract geographic attributes based on semantic features.
Ref:
Sengstock, C., Gertz, M., 2012. Latent geographic feature extraction from social media, in: Proceedings of the 20th International Conference on Advances in Geographic Information Systems, pp. 149–158.
Huang, Y., Li, Y., Shan, J., 2018. Spatial-temporal event detection from geo-tagged tweets. ISPRS International Journal of Geo-Information 7, 150.
Jahanbin, K., Rahmanian, V., 2020. Using twitter and web news mining to predict covid-19 outbreak. Asian Pacific Journal of Tropical Medicine 13.
Resch, B., Usländer, F., Havas, C., 2018. Combining machine-learning topic models and spatiotemporal analysis of social media data for disaster footprint and damage assessment. Cartography and Geographic Information Science 45, 362–376.
Gao, S., Janowicz, K., Couclelis, H., 2017. Extracting urban functional regions from points of interest and human activities on location-based social networks. Transactions in GIS 21, 446–467.
Steiger, E., Resch, B., Zipf, A., 2016. Exploration of spatiotemporal and semantic clusters of twitter data using unsupervised neural networks. International Journal of Geographical Information Science 30, 1694–1716.
Wang, W., Stewart, K., 2015. Spatiotemporal and semantic information extraction from web news reports about natural hazards. Computers, environment and urban systems 50, 30–40.
Zhu, R., Lin, D., Jendryke, M., Zuo, C., Ding, L., Meng, L., 2019. Geo-tagged social media data-based analytical approach for perceiving impacts of social events. ISPRS International Journal of Geo-Information 8, 15.
Diaz, J., Poblete, B., Bravo-Marquez, F., 2020. An integrated model for textual social media data with spatio-temporal dimensions. Information Processing & Management , 102219.
Di Rocco, L., Dassereto, F., Bertolotto, M., Buscaldi, D., Catania, B., Guerrini, G., 2020. Sherloc: a knowledge-driven algorithm for geolocating microblog messages at sub-city level. International Journal of Geographical Information Science 35, 84–115.
Severyn A, Moschitti A. Learning to rank short text pairs with convolutional deep neural networks[C]//Proceedings of the 38th international ACM SIGIR conference on research and development in information retrieval. 2015: 373-382.
Point 2: Overall, the manuscript is written in a way that makes reading and understanding a bit difficult. A careful proofreading by a professional English editing service is required.
Response 2:
We used the touch-up service of AJE agency to improve the article, In addition to that, we checked the expression of the article sentence by sentence. (https://secure.aje.com/en/researcher/submit/upload)
Point 3: L111: Different methods were adopted in this study, but it seems that you didn't provide necessary justifications on why you decided to use them.
Response 3:
Here is our explanation of why we use neural networks and this explanation is placed in the Study method section:
As we mentioned in Sect.2, the results of our study are expected to be interpretable rather than generating clusters using unsupervised training methods. Faced with the disambiguated text, we need to map it from the original space of symbolic words into some feature space encoding various aspects of their relatedness, e.g. lexical, syntactic, cooccurrence relations, frequency of occurrence, and semantics. Feature engineering is often an onerous task and may require external knowledge sources that are not always available or difficult to obtain (Severyn and Moschitti, 2015). Traditional text feature engineering has N-gram methods (Brown et al., 1992)(a tuple of N words that counts the probability of combining different N words together, with the total number of n-grams being the Nth power of the total number of words in the corpus) and One-hot methods (generating a feature vector of length of the total number of words in the corpus). Traditional methods can only learn local information, but deep learning methods represented by convolutional neural network (CNN) can learn more global information. It could obtain weights and weighted sums of different word combinations for the purpose of classification.
This is our explanation of why we use the dimensionality reduction algorithm and the choice of algorithm, this part is placed in the“5.2.2. Word properties“ section:
The neural networks have been successfully applied to many NLP tasks. However, neural network is a vector based model, it’s difficult to interpret how to build sentence meaning from the meanings of words and phrases (Li et al., 2015).It has been proved that we could extract sparse latent features by dimension reduction to obtain the geographical features of social media data (Sengstock and Gertz, 2012). For words in Weibo texts, we tried to display them using various dimensionality reduction methods, and constructed the co-word network of keywords. In NLP tasks, T-Distributed Stochastic Neighbor Embedding (T-SNE) methods have been shown to be more interpretive than traditional Principal Components Analysis (PCA) methods with Locally Linear Embedding (LLE) methods to get very good clustering of high-dimensional sentiment, numerical, and community attributes on a two-dimensional plane (Li et al., 2015).
This is our explanation of why we use co-word networks, this part is placed in the“4.2. Co-word network construction“ section:
Co-word analysis is a social network analysis method that was first used in the field of bibliometrics, and has been widely used in various studies exploring hot topics and trends (Zheng et al., 2019). It does not rely on any a priori knowledge and the detection results are more objective. For words in Weibo texts, we tried to display them using various dimensionality reduction methods, and constructed the co-word network of keywords. At the same time, there are also related studies that demonstrate that co-word analysis can be used to observe the collective human reactions to extreme events from social media data. This is a unique analytical perspective that can not only help us better understand human emotional states at different stages of major events, but also reveal the potential causes of events and improve the efficiency of event mitigation (Li et al., 2017). The COVID-19 pandemic, as an outbreak event, generated a lot of discussions on the Internet during the study period. As the event evolved, the importance and strength of association of different words in the co-word network changed all the time, and the community of words (acquired using a community discovery algorithm) was constantly reconfigured.
Ref:
Zheng L, Wang F, Zheng X, et al. Discovering the relationship of disasters from big scholar and social media news datasets. International Journal of Digital Earth, 2019, 12(11): 1341-1363.
Li, X., Wang, Z., Gao, C., Shi, L., 2017. Reasoning human emotional responses from large-scale social and public media. Applied Mathematics and Computation 310, 182–193.
Sengstock, C., Gertz, M., 2012. Latent geographic feature extraction from social media, in: Proceedings of the 20th International Conference on Advances in Geographic Information Systems, pp. 149–158.
Severyn, A., Moschitti, A., 2015. Learning to rank short text pairs with convolutional deep neural networks, in: Proceedings of the 38th international ACM SIGIR conference on research and development in information retrieval, pp. 373–382.
Brown, P.F., Della Pietra, V.J., Desouza, P.V., Lai, J.C., Mercer, R.L., 1992. Class-based n-gram models of natural language. Computational linguistics 18, 467–480.
Li, J., Chen, X., Hovy, E., Jurafsky, D., 2015. Visualizing and understanding neural models in nlp. arXiv preprint arXiv:1506.01066 .
Severyn A, Moschitti A. Learning to rank short text pairs with convolutional deep neural networks[C]//Proceedings of the 38th international ACM SIGIR conference on research and development in information retrieval. 2015: 373-382.
Coulombe C. Text data augmentation made simple by leveraging NLP cloud APIs. arXiv preprint arXiv:1812.04718, 2018.
Point 4: Results are described and/or explained, but how do we interpret them. For example, for Figure 4, "The higher the emotional value is, the higher the probability of positive emotion of Weibo users in the region is; a lower emotional value means that the emotional value of users in this region is low". Positive about what? What does low emotional value mean? Another example, "in Figure 5, the average number of comments on a single Weibo in Qingshan District is the highest and the overall Weibo show a negative state". Where do we see "the average number of comments on a single Weibo" and "the overall Weibo show a negative state" in the figure?
Response 4:
We add a description of sentiment value: sentiment value refers to the probability of a text being positive, which in this paper refers to the probability of a region (POI) being positive, as reflected by the mean value of the probability of a text being positive.
Content added to the main text:
PART1: The higher the sentiment value, the higher the positive sentiment probability of Weibo users in that region; the lower the sentiment value, the lower the negative sentiment probability value of users in that region.
PART2: It is a relatively mature research method to calculate the sentiment value by using a plain Bayesian classifier. We randomly selected 1,000 Weibos from a corpus of 200,000 Weibos for manual sentiment type discriminations, divided into negative, positive, and neutral. The labeled data are fed into a plain Bayesian classifier for calculation to learn the probability of occurrence of different words in Weibos for different sentiment types. The trained model scores the remaining Weibo to determine the probability that they belong to the positive type. In general, a probability value greater than 0.6 can judge that the Weibo has positive emotion, less than 0.4 can judge that the Weibo is negative, and the rest of the cases can judge that the Weibo is neutral.

Fig Emotional value calculation diagram
Regarding your second question, I have plotted the comparison of six attributes for seven districts in the main city of Wuhan in Fig. 5. Similar to the method used above to calculate the positive probability of POI/location, we calculate the probability of Weibo its negative/positive at the region scale. I hope my answer can make you satisfied.

Fig Indicator calculation process
Point 5: "Social sensing" is not well defined. Authors are encouraged to look into the papers from the following sources or beyond to better define the term:
"Social Sensing": https://www.mdpi.com/journal/sensors/special_issues/social_sensing
Articles available at ScienceDirect: https://www.sciencedirect.com/topics/computer-science/social-sensing
Response 5:
Thank you for your comments, I think they are excellent and I have read the references you recommended carefully and their definition of social sensing is extracted below.
1.Social sensing is an unsolicited form of crowdsourcing that refers primarily to spatiotemporally tagged big data and the methods and applications based on such big data. Social sensing allows for the observation of human behavior. These observations may be relevant and useful to the study but are not produced for this purpose and unlikely to follow a consistent reporting structure.
2.Social sensing is a form of unsolicited crowdsourcing which collects observations from social media. These may be relevant and useful to forecasters but are not produced for this purpose and unlikely to follow a consistent reporting structure.
3.Social sensing refers to a category of spatiotemporally tagged big data that provide an observatory for human behavior, as well as the methods and applications based on such big data.
4.A single observation (e.g., “My hayfever is really bad today!”) tied to a reasonably precise location may not alone allow precise models to be built, but by aggregating thousands of such observations over significant time periods, we aim here to show that accurate temporal and spatial distributions can be obtained for pollen and associated hayfever symptoms. The main technical challenge in social sensing is to extract high-quality observational data—relevant information tied to precise locations—from large numbers of unstructured, noisy, and possibly inaccurate user posts and their associated metadata.
5.The natural events for which social sensing has been successful tend to be extreme, episodic, as well as temporally and spatially bounded. Earthquakes and floods are prime examples. Social media users in a small area in a short time typically generate a low background number of tweets on a particular topic, but an extreme or unexpected event can generate a signal large enough to detect above the background of daily chatter.
I have modified the social sensing and social sensing data in the main text:
1. Social sensing is an unsolicited form of crowdsourcing that refers primarily to spatiotemporally tagged big data and the methods and applications based on such big data. Social sensing allows for the observation of human behavior. These observations may be relevant and useful to the study but are not produced for this purpose and unlikely to follow a consistent reporting structure (Liu et al., 2015; Cowie et al., 2018). Social sensing could extract characteristics and dynamics of social economy, culture, life, and other aspects from massive geo-spatial data (Liu et al., 2015). Every individual in society plays a role of a sensor, providing real-time feedback to the surrounding environment.
2. Compared with other data sources, social sensing data has two distinct advantages: first, it can capture socioeconomic characteristics well; second, sensors for these data are individuals (Chen et al., 2018).
Ref:
Cowie S, Arthur R, Williams H T P. @ choo: Tracking pollen and hayfever in the uk using social media. Sensors, 2018, 18(12): 4434.
Chen, W., Huang, H., Dong, J., Zhang, Y., Tian, Y., Yang, Z., 2018. Social functional mapping of urban green space using remote sensing and social sensing data. ISPRS Journal of Photogrammetry and Remote Sensing 146, 436–452.
Liu, Y., Liu, X., Gao, S., Gong, L., Kang, C., Zhi, Y., Chi, G., Shi, L., 2015. Social sensing: A new approach to understanding our socioeconomic environments. Annals of the Association of American Geographers 105, 512–530.
Point 6: The same applies to "Social sensing data", which requires a clear definition, especially when "app client usage", "taxi trajectory" and "remote sensing and night -time light remote sensing data" are listed as example social sensing data. In some places, social sensing data refers to "massive Internet data collected", e.g., "The social sensing method could extract reliable information from massive Internet data collected". Further, how is it different from geosocial media data?
Response 6:
After reading the references you provided, I defined social sensing data. Social sensing data have two important characteristics, one is that they can capture socio-economic characteristics well; and the second is that sensors for these data are individuals. Remote sensing data is not a data source for social sensing. Remote sensing data of night light meets the first characteristic, and it monitors spontaneous human economic activities, which also meets the second characteristic. Ordinary remote sensing is mainly used to view the changes of the earth and nature, while remote sensing of night light is an observation carried out with human as the center. We believe that remote sensing data of night light, App Client Usage data and taxi trajectory all belong to the category of social sensing. Geosocial media data is a true subset of social-sensing data and an important component. The main data used in this paper are also geosocial media data.
Social sensing also has some similar or analogous concepts as follows:
(At present, a number of similar but different big-data-related concepts have been proposed, such as volunteered geographical information (VGI; Goodchild 2007), crowdsourcing geographical information (Goodchild and Glennon 2010), and urban computing (Zheng et al. 2014). Aggarwal and Abdelzaher (2011, 2013) used the term social sensing for data collected from location-aware devices, such as Global Positioning System (GPS)-enabled vehicles or individuals. Additionally, some scholars have coined alternative terms, such as people-centric sensing (Campbell et al. 2008) and urban sensing (Lane et al. 2008), that have similar meanings. In this section, we would like to discuss these concepts to highlight the value of social sensing in the context of geographical studies.)
I have made the following changes in the text:
Compared with other data sources, social sensing data has two distinct advantages: first, it can capture socioeconomic characteristics well; second, sensors for these data are individuals (Chen et al., 2018). It is an important complement to high-precision geographic information data and sensor network data.
Ref:
Liu Y, Liu X, Gao S, et al. Social sensing: A new approach to understanding our socioeconomic environments[J]. Annals of the Association of American Geographers, 2015, 105(3): 512-530.
Chen W, Huang H, Dong J, et al. Social functional mapping of urban green space using remote sensing and social sensing data[J]. ISPRS Journal of Photogrammetry and Remote Sensing, 2018, 146: 436-452.
Point 7: You mentioned that you collected all the COVID-19 related original Weibo of Wuhan users from January 10 to February 17 through a Weibo crawler. How did you ensure ALL Weibo posts were collected? The number would also depend on the keywords used to filter Weibo posts. What keywords you used exactly? How did you ensure those keywords guaranty collection of ALL data?
Response 7:
We believe that the description "all" is inappropriate and we have modified it.
This paper collected most of the original Weibo related to the pandemic in Wuhan.
We have added the following description:
We have set up a list of search terms such as pneumonia, fever, virus, the abbreviation and full name of COVID-19 in Chinese, and hospital. I think it is possible to access most of the relevant discussions.
We will make this part of the data open source and available to all researchers.
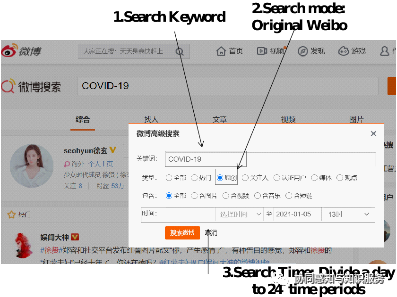
For the search content, we set a list of some keywords strongly related to COVID-19.
For the retrieval mode, we only crawl original tweets (Weibos), not considering retweets, aiming to obtain individual behaviors.
For the retrieval time, we use each hour as a scale and divide each day in the study interval into 24 time periods. The search is performed by time period and keyword using a script, and the results are also de-duplicated.
For the search location, we set Wuhan City, Hubei Province.
Point 8: You mentioned about co-words and co-occurrence relationship of words. How are they different from association rules applied to extract information from social media data? This question may also relate to the lack of proper literature review mentioned above.
Response 8:
I will combine this question with the question “please elaborate more on "The network contains the public's attitudes toward COVID-19 and the edges imply the changes and trends of the epidemic event, which provides us a unique angle for analyzing the public health event".” to answer:
Co-occurrence is the relationship between words, and Co-word is a method of analysis. Co-word analysis is a social network analysis method that was first used in the field of bibliometrics, and many scholars have used expert knowledge bases for information mining during the current COVID-19 pandemic.
At the same time, there are also related studies that demonstrate that co-word analysis can be used to observe the collective human reactions to extreme events from social media data. This is a unique analytical perspective that can not only help us better understand human emotional states at different stages of major events, but also reveal the potential causes of events and improve the efficiency of event mitigation. The COVID-19 pandemic, as an outbreak event, generated a lot of discussions on the Internet during the study period. As the event evolved, the importance and strength of association of different words in the co-word network changed all the time, and the community of words (acquired using a community discovery algorithm) was constantly reconfigured.
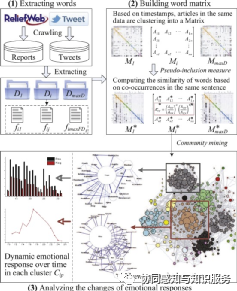
Fig. A schematic from the reference: Demonstrate the analysis of social media data using co-word analysis methods
Ref:
Danesh F, GhaviDel S, Piranfar V. Coronavirus: Discover the Structure of Global Knowledge, Hidden Patterns & Emerging Events[J]. Journal of Advances in Medical and Biomedical Research, 2020, 28(130): 253-264.
Li X, Wang Z, Gao C, et al. Reasoning human emotional responses from large-scale social and public media[J]. Applied Mathematics and Computation, 2017, 310: 182-193.
We have revised the text:
Co-word analysis is a social network analysis method that was first used in the field of bibliometrics, and has been widely used in various studies exploring hot topics and trends. It does not rely on any a priori knowledge and the detection results are more objective. For words in Weibo texts, we tried to display them using various dimensionality reduction methods, and constructed the co-word network of keywords. At the same time, there are also related studies that demonstrate that co-word analysis can be used to observe the collective human reactions to extreme events from social media data. This is a unique analytical perspective that can not only help us better understand human emotional states at different stages of major events, but also reveal the potential causes of events and improve the efficiency of event mitigation. The COVID-19 pandemic, as an outbreak event, generated a lot of discussions on the Internet during the study period. As the event evolved, the importance and strength of association of different words in the co-word network changed all the time, and the community of words (acquired using a community discovery algorithm) was constantly reconfigured.
Point 9: In-text citation format needs to be corrected throughout the entire paper based on CEUS guidelines to authors or a particular citation style.
Response 9:
We modified the citation style of latex files:
From:

To:

Point 10: Please think about titles of the most figures to make them more meaningful. & The title of Figure 1 needs to be rephrased - "four parts of article" doesn't make sense. Also, the figure is hard to understand and needs more explanations.
Response 10:
Here are some changes to the article:
Figure 1:
From: The relationship between the four parts of the article and method flowchart.
To: KE-CNN based geographic attribute identification of social sensing data.
Figure 2:
From: Construction steps of co-word network.
To: Construction of co-word networks based on co-occurrence relations of Weibo words
Figure 3:
From: KE-CNN model classification structure.
To: Model Structure for Geographic Attribute Classification of Weibo Using KE-CNN
Figure 4:
From: Social sensing distribution in the main urban area of Wuhan.
To: Emotional distribution of social sensing location in the main urban area of Wuhan.
Figure 5:
From: Radar chart of normalized index of each region.
To: Radar chart of normalized indicators for each region of Wuhan city. (Weibo Number, Population, Positive Probability, Average Repost, Average Reviews, Confirm Number)
Figure 6:
From: Distribution of Weibo of different features.
To: Distribution of Weibo with different attribute POIs.
Figure 8:
From: Distribution of words. (A) PCA method + community attributes; (B) PCA method + emotion attributes; (C) T-SNE method + community attributes; (D) T-SNE method + emotion attributes; (E) LLE method + community attributes; (F) LLE method + emotion attributes.
To: The dimensionality reduction distribution of word vectors. (A) PCA method + community attributes; (B) PCA method + emotion attributes; (C) T-SNE method + community attributes; (D) T-SNE method + emotion attributes; (E) LLE method + community attributes; (F) LLE method + emotion attributes.
Point 11: Page 2, line 20: what are "recovery estimate methods"?。& Page 3, line 44: what do you mean about "modal particles"?
Response 11:
I am ashamed to see those error and thank you for your guidance. I think " Traditional sensing and assessment methods" is more appropriate here.
1.From:
recovery estimate methods
To:
traditional sensing and assessment methods
2. From:
There are some meaningless modal particles, auxiliary words, and punctuation marks in the corpus, which can affect the dimension of co-word matrix, so it is necessary to preprocess the data through constructing a user dictionary and stop word dictionary.
To:
There are some meaningless inflections, auxiliaries, punctuation, etc. in the corpus, and we filter the data using a dictionary of commonly used stop words and a user-defined dictionary.
Point 12: Page 2, line 33-34: does KE-CNN stand for "keyword extraction and synonym substitution"?
Response 12:
According to your comments, I define KE-CNN (keyword extraction and synonym substitution - Convolutional Neural Networks) in the Related works section.
Point 13: Page 3: what do you mean about geo-decode here?
Response 13:
Here it should be geocode and not geo-decode.
We made the change:
The location information contained in social media data is usually in the form of address descriptions, so we geocode it to get the specific latitude and longitude.
Point 14:
Page 3 stated "The location information contained in social media data usually exists in the form of address description". Does Weibo geotag check-in records if users used a smart phone and the location service of the phone is turned on?
Response 14:
Thank you for your suggestion, both Weibo and Twitter have turned off the precise location function, so the locations obtained are described in text form, such as so-and-so hospital, so-and-so university so-and-so teaching building.
Point 15: Page 3 stated "Due to the difference between Baidu coordinates and WGS84 coordinates, the error may reach hundreds of meters, so it is necessary to correct the coordinates". How did you correct errors?
Response 15:
WGS84 is a geographic coordinate system and Baidu coordinate system (GCJ-02) is a projection coordinate system, we developed a script to convert it, the script is attached at the end of the document. After consideration, I think this part is not the core of the article and will cause confusion to the readers, so I have removed it in the revised version.
Point 16: Page 6, line 47-51: What are the "50 labeled data"? Why did you select 4,313 Weibo?& Page 7, line 40: Why 1013? Do you mean geocoded rather than geo-decoded?
Response 16:
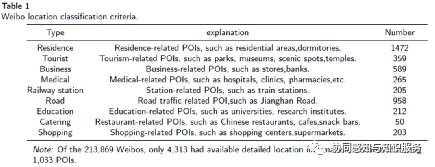
50 labeled data means 50 tagged Weibo data. Of the 213,869 Weibos, only 4,313 had available detailed location information, distributed among 1,033 POIs (Since a location has multiple Weibos). A corpus consisting of about 200,000 Weibos is the input to our training word vector, and 4313 Weibos are the input to our classification model.
We make the following changes:
From: We want to extract the text features of users’ Weibo content with the same geographic location type. In order to avoid accidental errors, we only selected nine types of location types that have more than 50 labeled data, which are estate, tourism, business, medical, railway, road & transport, education, catering, and shopping. In this way, we established the relationship between Weibo text and real space, and selected 4,313 Weibo as the model input for the next step.
To:
1. We want to learn the characteristics of the Weibo text for different geographical locations. To avoid chance errors, we chose 9 location types which have more than 50 tagged Weibo data.
(This sentence is in In chapter 3)
2.We want to extract text features of Weibos in the same location type. The data for our study are 4313 Weibos distributed in 9 location types (including estate, tourism, business, medical, railway, road & transport, education, catering, and shopping types). As shown in Table 1, there are more than 50 Weibos data for each type of location. In this way, we established the relationship between the Weibo text and the real space, and these text were used as model inputs for the next step of the study.
In response to the second question, I make the following changes:
From: In the seven districts located in main urban area, 1033 check-in locations were geo-decoded and divided into nine feature types. The emotional attitude of Weibo texts in different geographic locations was computed, and the results are presented in Fig.4
To: As mentioned in Sect.3, we collected 1,033 check-in locations and geographically decoded them into 9 feature types. We consider the mean value of the positive probability of all Weibos sentiment at each location as the emotional value of the location point.
Point 17: Page 7: Figure 4 should be part your results, not part of methodology.
Response 17:
Revisions have been made. The automatic Latex layout used at the beginning, where the figure and the text were not close together, has been repositioned in the revised version with respect to the picture and the table.
I sincerely think your comments are detailed and serious, for which I am very grateful, and I checked the article in detail.
Original Manuscript ID: CEUS-D-20-00494
Original Article Title: “KE-CNN: A new social sensing method for extracting geographical attributes from text semantic features and its application in Wuhan, China”
To: CEUS Editor and anonymous reviewers
Re: Response to reviewers
Point 1: Interesting paper but needs some improvements. First, what is the research objective of this study? This is not clearly articulated. The discussion is more about what the authors did and methods used rather than the scientific goals of the research. The new contribution should be clearly stated.
Response 1:
Thanks for the suggestion and we think your comments are reasonable. The article's introduction and related work have been substantially revised. You could view the changes in the corrected version.
The research questions this paper answers are as follows:
(RQ1):What interesting conclusions can be drawn about the COVID-19 pandemic based on social media data using social sensing?
(RQ2):Considering the increasingly stringent privacy protection on social media platforms, how can the geographic attributes of social media texts be inferred from the frequency of word occurrence and co-word relationship when there is no address description in the text?
Research question 1 is some applied contribution and research question 2 is our methodological contribution. Corresponding to the research question, our main contributions are twofold:
● From a methodological perspective, this paper proposes a convolutional neural network geographic classification model based on keyword extraction and synonym substitution (KE-CNN) which could determine the geographic attribute by extracting the semantic features from text data.
● From an application perspective, this paper achieves non-contact pandemic social sensing by capturing the spatial behaviors of a large number of people, and construct a co-word composite network to obtain public opinion information.
And we discuss it at the end of the article:
Under the various inconvenient circumstances caused by COVID-19, we could resort to geosocial sensing methods for non-contact, large-scale, and deep-level sensing of the social and economic operation. Based on the background of public health events in Wuhan, this paper studied the temporal and spatial distribution of online topic networks, hot spots of residents' attention, and the location information behind the online discussion. The experiment results show that (1) social sensing has the ability to discriminate the emotional attitude of citizens in different locations and to extract the keywords of mainstream opinions (2) the prediction of ground feature type based on Weibo text is possible, and it shows good precision in certain types (medical type, catering type, railway station type, and education type) using our proposed KE-CNN method.
Point 2: Figure 4 - why is the most saturated red used for the most positive emotion? Typically we would assign a saturated red color to the most negative of values. In the paper (line 43 page 7) the authors state that the higher the emotional values, the higher the probability of positive emotion but as lockdown approached and news about the virus started to be distributed would you expect high positive emotion? What do we actually learn from Figure 4? According to this figure both positive and (negative?) emotions were located side by side… There seemed to be a heterogenous mix of emotions according to this figure. Was this for the entire study period? Did you try to analyze change in patterns at all?
Response 2:
Figure 4 - why is the most saturated red used for the most positive emotion? Typically we would assign a saturated red color to the most negative of values.
Thanks for the suggestion. We have taken your comments and adjusted the color scheme of the pictures. Put red for negative and yellow for positive. Added a description related to affective computing.
From:

To:

In the paper (line 43 page 7) the authors state that the higher the emotional values, the higher the probability of positive emotion but as lockdown approached and news about the virus started to be distributed would you expect high positive emotion?
Based on the data available, we calculated the percentage of negative tweets and the change in the number of tweets during the study period, as shown in the figure below, where A represents the time when Wuhan was "closed" and B represents the time when the "collect all" policy (All suspected cases are admitted for treatment) was introduced.
The geographical distribution plotted in the paper refers to the spatial differences in emotional attitudes. Temporal differences can be reflected in the line graph, where emotions are dynamic over time.

What do we actually learn from Figure 4? According to this figure both positive and (negative?) emotions were located side by side… There seemed to be a heterogenous mix of emotions according to this figure. Was this for the entire study period? Did you try to analyze change in patterns at all?
We are plotting Figure 4 based on data from the entire study period. Inspired by your comment, I used Moran Index to analyze its spatial distribution. The Moran index analysis of the positive sentiment value of the check-in location, with an index value of 0.033 at the confidence level of p<0.05.< span="">
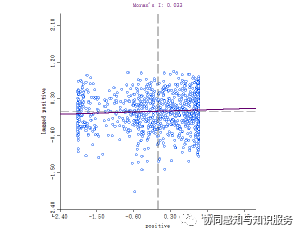
Fig: Moran Index Analysis Results
The results of the analysis of the Moran index demonstrate that locations with high sentiment values are spatially clustered, but this effect is weak, and most of the high sentiment locations show a staggered distribution in space with low sentiment locations.
We have made the following modifications to the text:
Within the study interval, Jiang’an district and Jianghan District have a high degree of discussion heat. The number of extremely positive and extremely negative positions in the city is roughly equal and the heat is not high. Besides, there are some ground feature nodes with more than 300 discussion numbers in the study area, and the Weibo text generally presents a neutral and positive state. There is a heterogeneous mix of sentiments in the study area, with locations with high emotion value having a less pronounced aggregation effect with locations with low emotion value, showing a staggered distribution in space.
Point 3: I am not clear about the results obtained for learning geographic information from semantic features. Please explain the 9 POI types, by tourist do you mean hotels? Or are you referring to tourist sites (e.g., a temple) in a city? Or both? What do you mean by real estate? Are you referring here to residential neighborhoods? Does catering include restaurants and dining establishments? There are many different semantics associated with the labels that you use so what level of detail is actually learned by the model as a result? Please clarify for readers.
Response 3:
Based on your comments, we defined the result of learning geographic information from semantic features as geographic attributes.
Geographical attributes refer to the location information embedded behind social media texts, and this location information is not detailed address information, but the functional type of the address. Unlike the traditional methods of extracting detailed location information from texts based on dictionary matching or named entity recognition, this paper proposes a neural network-based approach to discover the geographical semantic information embedded in texts. Even if the relevant words describing the location do not exist in the social media text, our method can still infer the type of address (Geographical attributes) behind the words from their probability of occurrence in the text or the probability of co-occurrence of different words. Our method treats each word and the combination between different words as an observation, and makes inferences based on these observations.
We have considered carefully about your comments and have created the following table to illustrate the nine geographic attribute types used in this paper. We added the table in Section 3:
Point 4: In the discussion of overfitting the model (line 33) you mention adding two dropout layers. Can you say a little more about e.g., what probability you used to implement the dropout layers?
Response 4:
To make the model more robust, with better generalization, I added two Dropout layers with parameters set to 0.2, losing 20% of the connections at random each time.

Fig: Dropout Schematic
We modify the text as follows:
In order to solve this problem, we added two dropout layers (with parameters set to 0.2, losing 20% of the connections at random each time) before the two dense layers. Dropout layers can make the model more robust and have a better generalization ability. Adding dropout layer will make neural network eliminate some connections randomly, and these connections will not participate in calculation.
Some of the code for model building is appended here:
model.add(layers.Conv2D(32, (3, 3), activation='relu', input_shape=(100, 768, 1),kernel_regularizer=regularizers.l1_l2(0.001)))
model.add(layers.MaxPooling2D((2, 2)))
model.add(layers.Conv2D(64, (3, 3), activation='relu'))
model.add(layers.MaxPooling2D((2, 2)))
model.add(layers.Conv2D(64, (3, 3), activation='relu'))
model.add(layers.Flatten())
model.add(layers.Dropout(0.2))
model.add(layers.Dense(64, activation='tanh'))
model.add(layers.Dropout(0.2))
model.add(layers.Dense(9, activation='softmax'))
Reference to the dropout method is added here.
Srivastava N, Hinton G, Krizhevsky A, et al. Dropout: a simple way to prevent neural networks from overfitting[J]. The journal of machine learning research, 2014, 15(1): 1929-1958.
Point 5: The legend for Figure 7 refers to 3 classes. But the discussion of this figure refers to 3 communities or topic lists. Do the classes map to communities? This needs to be clarified. Also community refers to network structure in some discussions and then is used in another way I believe on p. 12 where the authors seem to be discussing geographic communities (community scale social sensing). This is confusing to use the same term in different ways.
How was the emotion analysis handled (what classifier was used to compute emotion)? How were topics or keywords assigned emotions? Was there any manual annotation used to check the model results at all or were all validation results computed?
Response 5:
For the interpretation of communities:
I use the Louvain algorithm mentioned in the article to classify communities based on word co-occurrence relationships. All words are labeled, and each label Class is a community. I modify the legend of Figure 7 from Class to community to avoid confusing the reader.
Page 12 of the original article mentions: “Using the method of social sensing to carry out situation awareness and knowledge fusion in geographical space can effectively extract the changing direction and regional distribution of social public opinion as shown in Figure 4-7. Community scale social sensing could be combined with remote sensing big data, traffic big data, real-time heat of population and other methods to achieve multi-scale seamless perception. Besides, we propose a semantic geographic classification model based on the epidemic related topic Weibo with geo-tags as the training corpus, which can achieve good classification effect for some feature types. Our experiment proves that it is feasible to let the model learn geographic information from semantic features. Moreover, we could generate a pre-trained model by training large-scale and full-scale corpus to achieve better robustness and mobility. When encountering a new social sensing environment, researcher could use transfer learning to speed up training and improve the performance of your deep learning model. However, the model still has some limitations. The model does not consider the context of words to optimize, and the polysemy problem also needs to be solved.”
I intended to refer to the scale of my study on a smaller scale such as neighborhood/ community scale, which may mislead the reader, and removed the relevant description in the revised version.
Regarding your comment on sentiment computing, I added a detailed description:
It is a relatively mature research method to calculate the sentiment value by using a plain Bayesian classifier. We randomly selected 1,000 Weibos from a corpus of 200,000 Weibos for manual sentiment type discriminations, divided into negative, positive, and neutral. The labeled data are fed into a plain Bayesian classifier for calculation to learn the probability of occurrence of different words in Weibos for different sentiment types. The trained model scores the remaining Weibo to determine the probability that they belong to the positive type. In general, a probability value greater than 0.6 can judge that the Weibo has positive emotion, less than 0.4 can judge that the Weibo is negative, and the rest of the cases can judge that the Weibo is neutral.
Point 6: What biases are present in Weibo data? Does this collected data share similar biases found with Twitter data?
Response 6:
I think it’s a very interesting question. Some scholars have studied the differences between the Weibo data of Wuhan and the twitter data before and after the closure of Lombardy in Italy. The results showed that individuals focused more on “home”, and expressed a higher level of cognitive process after a lockdown in both Wuhan and Lombardy. Meanwhile, the level of stress decreased, and the attention to leisure increased in Lombardy after the lockdown. The attention to group, religion, and emotions became more prevalent in Wuhan after the lockdown. In addition, some scholars have compared the pulses of categorical hot events in twitter and Weibo. The difference is also very interesting.
Here are the references for the above discussion.
Ref:
Su Y, Xue J, Liu X, et al. Examining the impact of COVID-19 lockdown in Wuhan and Lombardy: a psycholinguistic analysis on Weibo and Twitter[J]. International journal of environmental research and public health, 2020, 17(12): 4552.
Shuai X, Liu X, Xia T, et al. Comparing the pulses of categorical hot events in twitter and weibo[C]//Proceedings of the 25th ACM conference on Hypertext and social media. 2014: 126-135.
In response to the deficiencies in social sensing, I provide the following discussion in the last part of the article:
Social sensing can extract reliable information from a large amount of data containing noise, however, this information extracted from social sensing can be biased (Wang et al., 2015). The entire narrative of the paper is developed within the framework of social sensing based on social media data, while social media does not completely cover everyone, and people react and express the same events differently. In addition, how to denoise from the massive social media data is also a challenging research problem.
Original Manuscript ID: CEUS-D-20-00494
Original Article Title: “KE-CNN: A new social sensing method for extracting geographical attributes from text semantic features and its application in Wuhan, China”
To: CEUS Editor and anonymous reviewers
Re: Response to reviewers
Point 1: The manuscript presents a new machine learning method to mine locational attribution (land-use type) from social media texts. Such inferences are potentially valuable given that the increasingly strict privacy protection on social media platforms is limiting the availability of geo-tagged-ready data sources. The paper is generally of good quality. Although, I suggest the following revisions regarding the narrative, visualization, and presentation of the manuscript.
Response 1:
I am honored to have your positive comments, and I have revised the manuscript and touched up the phrases.
Point 2: 1. The overall narrative needs to be refined. It is clear that the major contribution of the work concerns the KE-CNN model, whereas other models and analysis, including the SLP models, descriptive statistics, and word-network analysis are either of a supportive role to the main KE-CNN model, or minor additions to the main contribution. However, the current narrative of the manuscript does not reflect this structure and the major contribution is not adequately highlighted.
Response 2:
The research questions this paper answers are as follows:
(RQ1):What interesting conclusions can be drawn about the COVID-19 pandemic based on social media data using social sensing?
(RQ2):Considering the increasingly stringent privacy protection on social media platforms, how can the geographic attributes of social media texts be inferred from the frequency of word occurrence and co-word relationship when there is no address description in the text?
Research question 1 is some applied contribution and research question 2 is our methodological contribution. Corresponding to the research question, our main contributions are twofold:
● From a methodological perspective, this paper proposes a convolutional neural network geographic classification model based on keyword extraction and synonym substitution (KE-CNN) which could determine the geographic attribute by extracting the semantic features from text data.
● From an application perspective, this paper achieves non-contact pandemic social sensing by capturing the spatial behaviors of a large number of people, and construct a co-word composite network to obtain public opinion information.
In response to question "the current narrative of the manuscript does not reflect this structure", we modified the description of Figure 1 to strengthen the relationship between the methods.
As shown in Figure 1, the experimental process of this paper is mainly divided into four parts, data preprocessing and corpus construction(Sect.3), corpus vectorization(Sect.4.1), co-word network construction(Sect.4.2) and semantic based geographic classification(Sect.4.3). We mainly do the data capture and preprocessing, and encoding Weibo into a corpus with words as the smallest composition In Part.1, which is the basis of the next part. In Part.2, we mainly focus on the vectorization of corpus and the result of this part will be the model input of the Part.4. Based on the preprocessed corpus, the Part.3 will build a co-word complex network, which is the contrast and supplement of the Part.4.
Besides, we have added some explanations in the text as to why these methods were used:
Such as word-network:
Co-word analysis is a social network analysis method that was first used in the field of bibliometrics, and has been widely used in various studies exploring hot topics and trends (Zheng et al., 2019). It does not rely on any a priori knowledge and the detection results are more objective. For words in Weibo texts, we tried to display them using various dimensionality reduction methods, and constructed the co-word network of keywords. At the same time, there are also related studies that demonstrate that co-word analysis can be used to observe the collective human reactions to extreme events from social media data. This is a unique analytical perspective that can not only help us better understand human emotional states at different stages of major events, but also reveal the potential causes of events and improve the efficiency of event mitigation (Li et al., 2017). The COVID-19 pandemic, as an outbreak event, generated a lot of discussions on the Internet during the study period. As the event evolved, the importance and strength of association of different words in the co-word network changed all the time, and the community of words (acquired using a community discovery algorithm) was constantly reconfigured.
Such as SLP models:
As we mentioned in Sect.2, the results of our study are expected to be interpretable rather than generating clusters using unsupervised training methods. Faced with the disambiguated text, we need to map it from the original space of symbolic words into some feature space encoding various aspects of their relatedness, e.g. lexical, syntactic, cooccurrence relations, frequency of occurrence, and semantics. Feature engineering is often an onerous task and may
require external knowledge sources that are not always available or difficult to obtain (Severyn and Moschitti, 2015). Traditional text feature engineering has N-gram methods (Brown et al., 1992)(a tuple of N words that counts the probability of combining different N words together, with the total number of n-grams being the Nth power of the total number of words in the corpus) and One-hot methods (generating a feature vector of length of the total number of words in the corpus). Traditional methods can only learn local information, but deep learning methods represented by convolutional neural network (CNN) can learn more global information. It could obtain weights and weighted sums of different word combinations for the purpose of classification.
Such as dimensionality reduction algorithm:
The neural networks have been successfully applied to many NLP tasks. However, neural network is a vector based model, it’s difficult to interpret how to build sentence meaning from the meanings of words and phrases (Li et al., 2015).It has been proved that we could extract sparse latent features by dimension reduction to obtain the geographical features of social media data (Sengstock and Gertz, 2012). For words in Weibo texts, we tried to display them using various dimensionality reduction methods, and constructed the co-word network of keywords. In NLP tasks, T-Distributed Stochastic Neighbor Embedding (T-SNE) methods have been shown to be more interpretive than traditional Principal Components Analysis (PCA) methods with Locally Linear Embedding (LLE) methods to get very good clustering of high-dimensional sentiment, numerical, and community attributes on a two-dimensional plane (Li et al., 2015).
Ref:
Teller V. Speech and language processing: an introduction to natural language processing, computational linguistics, and speech recognition. Computational Linguistics, 2000, 26(4): 638-641.
Sengstock, C., Gertz, M., 2012. Latent geographic feature extraction from social media, in: Proceedings of the 20th International Conference on Advances in Geographic Information Systems, pp. 149–158.
Huang, Y., Li, Y., Shan, J., 2018. Spatial-temporal event detection from geo-tagged tweets. ISPRS International Journal of Geo-Information 7, 150.
Jahanbin, K., Rahmanian, V., 2020. Using twitter and web news mining to predict covid-19 outbreak. Asian Pacific Journal of Tropical Medicine 13.
Resch, B., Usländer, F., Havas, C., 2018. Combining machine-learning topic models and spatiotemporal analysis of social media data for disaster footprint and damage assessment. Cartography and Geographic Information Science 45, 362–376.
Gao, S., Janowicz, K., Couclelis, H., 2017. Extracting urban functional regions from points of interest and human activities on location-based social networks. Transactions in GIS 21, 446–467.
Steiger, E., Resch, B., Zipf, A., 2016. Exploration of spatiotemporal and semantic clusters of twitter data using unsupervised neural networks. International Journal of Geographical Information Science 30, 1694–1716.
Wang, W., Stewart, K., 2015. Spatiotemporal and semantic information extraction from web news reports about natural hazards. Computers, environment and urban systems 50, 30–40.
Zhu, R., Lin, D., Jendryke, M., Zuo, C., Ding, L., Meng, L., 2019. Geo-tagged social media data-based analytical approach for perceiving impacts of social events. ISPRS International Journal of Geo-Information 8, 15.
Diaz, J., Poblete, B., Bravo-Marquez, F., 2020. An integrated model for textual social media data with spatio-temporal dimensions. Information Processing & Management , 102219.
Di Rocco, L., Dassereto, F., Bertolotto, M., Buscaldi, D., Catania, B., Guerrini, G., 2020. Sherloc: a knowledge-driven algorithm for geolocating microblog messages at sub-city level. International Journal of Geographical Information Science 35, 84–115.
Severyn A, Moschitti A. Learning to rank short text pairs with convolutional deep neural networks[C]//Proceedings of the 38th international ACM SIGIR conference on research and development in information retrieval. 2015: 373-382.
Point 3: 2. There are some obvious omissions and errors in the manuscript. For example, (1) in Section 4.1, the author mentioned using a Bayesian classifier to analyze the emotional attitude of the Weibo texts, but never described the classifier, nor gave any references concerning it. (2) The six dimensions in Figure 5 are not in line with the respective descriptions in Section 4.1.1, which only gives five dimensions (omitting confirmed COVID-19 case number?). (3) Figure 6 does not have a Y-axis annotation. etc.
Response 3:
(1) in Section 4.1, the author mentioned using a Bayesian classifier to analyze the emotional attitude of the Weibo texts, but never described the classifier, nor gave any references concerning it.
We have added the relevant description in Section 5.1:
It is a relatively mature research method to calculate the sentiment value by using a plain Bayesian classifier. We randomly selected 1,000 Weibos from a corpus of 200,000 Weibos for manual sentiment type discriminations, divided into negative, positive, and neutral. The labeled data are fed into a plain Bayesian classifier for calculation to learn the probability of occurrence of different words in Weibos for different sentiment types. The trained model scores the remaining Weibo to determine the probability that they belong to the positive type. In general, a probability value greater than 0.6 can judge that the Weibo has positive emotion, less than 0.4 can judge that the Weibo is negative, and the rest of the cases can judge that the Weibo is neutral.
Here are two additional references on affective computing.
Ref:
Pang B, Lee L, Vaithyanathan S. Thumbs up? Sentiment classification using machine learning techniques[J]. arXiv preprint cs/0205070, 2002.
Jagdale R S, Shirsat V S, Deshmukh S N. Sentiment analysis on product reviews using machine learning techniques[J]. Cognitive Informatics and Soft Computing, 2019: 639-647.
(2) The six dimensions in Figure 5 are not in line with the respective descriptions in Section 4.1.1, which only gives five dimensions (omitting confirmed COVID-19 case number?)
Thank you for your careful suggestions, we add the missing dimensions (Confirmed case) in the revised version.
1. the average number of comments on a single Weibo, 2. the average forwarding number of a single Weibo, 3. the negative and positive probability of Weibo, 4. the number of permanent residents in the statistical yearbook in 2018, 5. the number of confirmed COVID-19 cases,and 6. the total number of Weibo.
(3) Figure 6 does not have a Y-axis annotation. etc.
Thank you for your careful suggestions, we add the missing Y-axis annotation.
Since a location has multiple Weibos, we have plotted Figure 1 to show the difference in the number of Weibos from different locations.
As shown on the x-axis of Figure 6, there are different types of Weibo locations, and the y-axis represents the number of Weibos from the same location.

Fig6 Distribution of Weibo with different attribute POIs.
Point 4: 3. Be careful when trying to interpret or extend the analysis. For example, in Section 4.1.2 the author used "sent from", which is not necessarily true as whole narrative is framed under the social sensing approach, it would be of much users can actually choose the geo-tag of a tweet subjectively.
Response 5:
Thanks for the suggestion and I think your consideration is reasonable.
Users can actually choose the geo-tag of a Weibo subjectively and may not actually be in the location where the geo-tag is displayed. However, we believe that there is also a link between the content of the Weibo and the geo-tag (even if the user is not in that position), and this paper is intended to explore this link.
I have thought about your idea and made the following changes.
Locations with the geographic attribute railway station have a much higher number of Weibos than other types in terms of the median and upper quantile.
Point 6: Further, as the value if the author could offer some insights on the possible bias of the specific social sensing method, ad discuss its implications.
Response 6:
We think your comments are constructive, and we have revised the conclusion section in response to your comments.
From:
The data range of social sensing is very wide, and different data can be well integrated. In this paper, social sensing refers to social media data sensing. The sources of social media data are very rich, starting from traditional text, and gradually evolving into a richer form with pictures, video streams, and multimedia integration. In the face of this new development, various deep learning algorithms can be used to refine the data (Sui and Goodchild, 2011).
To:
Social sensing can extract reliable information from a large amount of data containing noise, however, this information extracted from social sensing can be biased (Wang et al., 2015). The entire narrative of the paper is developed within the framework of social sensing based on social media data, while social media does not completely cover everyone, and people react and express the same events differently. In addition, how to denoise from the massive social media data is also a challenging research problem.
Ref:
Wang D, Abdelzaher T, Kaplan L. Social sensing: building reliable systems on unreliable data[M]. Morgan Kaufmann, 2015.
Point 7: The language in the manuscript needs to be improved. Many expressions are vague or redundant and constitute obstacles to the readers' reading experiences.
Response 7:
Based on the reviewer's comments, we used the touch-up service of AJE agency to improve the article, In addition to that, we checked the expression of the article sentence by sentence. (https://secure.aje.com/en/researcher/submit/upload) We look forward to your approval of our work. If you have any questions, we are happy to hear your comment to make it better.